Sunday, November 19, 2017

toolsmith #129 - DFIR Redefined: Deeper Functionality for Investigators with R - Part 2

You can have data without information, but you cannot have information without data. ~Daniel Keys Moran

Here we resume our discussion of DFIR Redefined: Deeper Functionality for Investigators with R as begun in Part 1.
First, now that my presentation season has wrapped up, I've posted the related material on the Github for this content. I've specifically posted the most recent version as presented at SecureWorld Seattle, which included Eric Kapfhammer's contributions and a bit of his forward thinking for next steps in this approach.
When we left off last month I parted company with you in the middle of an explanation of analysis of emotional valence, or the "the intrinsic attractiveness (positive valence) or averseness (negative valence) of an event, object, or situation", using R and the Twitter API. It's probably worth your time to go back and refresh with the end of Part 1. Our last discussion point was specific to the popularity of negative tweets versus positive tweets with a cluster of emotionally neutral retweets, two positive retweets, and a load of negative retweets. This type of analysis can quickly give us better understanding of an attacker collective's sentiment, particularly where the collective is vocal via social media. Teeing off the popularity of negative versus positive sentiment, we can assess the actual words fueling such sentiment analysis. It doesn't take us much R code to achieve our goal using the apply family of functions. The likes of apply, lapply, and sapply allow you to manipulate slices of data from matrices, arrays, lists and data frames in a repetitive way without having to use loops. We use code here directly from Michael Levy, Social Scientist, and his Playing with Twitter Data post.

polWordTables = 
  sapply(pol, function(p) {
    words = c(positiveWords = paste(p[[1]]$pos.words[[1]], collapse = ' '), 
              negativeWords = paste(p[[1]]$neg.words[[1]], collapse = ' '))
    gsub('-', '', words)  # Get rid of nothing found's "-"
  }) %>%
  apply(1, paste, collapse = ' ') %>% 
  stripWhitespace() %>% 
  strsplit(' ') %>%
  sapply(table)

par(mfrow = c(1, 2))
invisible(
  lapply(1:2, function(i) {
    dotchart(sort(polWordTables[[i]]), cex = .5)
    mtext(names(polWordTables)[i])
  }))

The result is a tidy visual representation of exactly what we learned at the end of Part 1, results as noted in Figure 1.

Figure 1: Positive vs negative words
Content including words such as killed, dangerous, infected, and attacks are definitely more interesting to readers than words such as good and clean. Sentiment like this could definitely be used to assess potential attacker outcomes and behaviors just prior, or in the midst of an attack, particularly in DDoS scenarios. Couple sentiment analysis with the ability to visualize networks of retweets and mentions, and you could zoom in on potential leaders or organizers. The larger the network node, the more retweets, as seen in Figure 2.

Figure 2: Who is retweeting who?
Remember our initial premise, as described in Part 1, was that attacker groups often use associated hashtags and handles, and the minions that want to be "part of" often retweet and use the hashtag(s). Individual attackers either freely give themselves away, or often become easily identifiable or associated, via Twitter. Note that our dominant retweets are for @joe4security, @HackRead,  @defendmalware (not actual attackers, but bloggers talking about attacks, used here for example's sake). Figure 3 shows us who is mentioning who.

Figure 3: Who is mentioning who?
Note that @defendmalware mentions @HackRead. If these were actual attackers it would not be unreasonable to imagine a possible relationship between Twitter accounts that are actively retweeting and mentioning each other before or during an attack. Now let's assume @HackRead might be a possible suspect and you'd like to learn a bit more about possible additional suspects. In reality @HackRead HQ is in Milan, Italy. Perhaps Milan then might be a location for other attackers. I can feed  in Twittter handles from my retweet and mentions network above, query the Twitter API with very specific geocode, and lock it within five miles of the center of Milan.
The results are immediate per Figure 4.

Figure 4: GeoLocation code and results
Obviously, as these Twitter accounts aren't actual attackers, their retweets aren't actually pertinent to our presumed attack scenario, but they definitely retweeted @computerweekly (seen in retweets and mentions) from within five miles of the center of Milan. If @HackRead were the leader of an organization, and we believed that associates were assumed to be within geographical proximity, geolocation via the Twitter API could be quite useful. Again, these are all used as thematic examples, no actual attacks should be related to any of these accounts in any way.

Fast Frugal Trees (decision trees) for prioritizing criticality

With the abundance of data, and often subjective or biased analysis, there are occasions where a quick, authoritative decision can be quite beneficial. Fast-and-frugal trees (FFTs) to the rescue. FFTs are simple algorithms that facilitate efficient and accurate decisions based on limited information.
Nathaniel D. Phillips, PhD created FFTrees for R to allow anyone to easily create, visualize and evaluate FFTs. Malcolm Gladwell has said that "we are suspicious of rapid cognition. We live in a world that assumes that the quality of a decision is directly related to the time and effort that went into making it.” FFTs, and decision trees at large, counter that premise and aid in the timely, efficient processing of data with the intent of a quick but sound decision. As with so much of information security, there is often a direct correlation with medical, psychological, and social sciences, and the use of FFTs is no different. Often, predictive analysis is conducted with logistic regression, used to "describe data and to explain the relationship between one dependent binary variable and one or more nominal, ordinal, interval or ratio-level independent variables." Would you prefer logistic regression or FFTs?

Figure 5: Thanks, I'll take FFTs
Here's a text book information security scenario, often rife with subjectivity and bias. After a breach, and subsequent third party risk assessment that generated a ton of CVSS data, make a fast decision about what treatments to apply first. Because everyone loves CVSS.

Figure 6: CVSS meh
Nothing like a massive table, scored by base, impact, exploitability, temporal, environmental, modified impact, and overall scores, all assessed by a third party assessor who may not fully understand the complexities or nuances of your environment. Let's say our esteemed assessor has decided that there are 683 total findings, of which 444 are non-critical and 239 are critical. Will FFTrees agree? Nay! First, a wee bit of R code.

library("FFTrees")
cvss <- c:="" coding="" csv="" p="" r="" read.csv="" rees="">cvss.fft <- data="cvss)</p" fftrees="" formula="critical">plot(cvss.fft, what = "cues")
plot(cvss.fft,
     main = "CVSS FFT",
     decision.names = c("Non-Critical", "Critical"))


Guess what, the model landed right on impact and exploitability as the most important inputs, and not just because it's logically so, but because of their position when assessed for where they fall in the area under the curve (AUC), where the specific curve is the receiver operating characteristic (ROC). The ROC is a "graphical plot that illustrates the diagnostic ability of a binary classifier system as its discrimination threshold is varied." As for the AUC, accuracy is measured by the area under the ROC curve where an area of 1 represents a perfect test and an area of .5 represents a worthless test. Simply, the closer to 1, the better. For this model and data, impact and exploitability are the most accurate as seen in Figure 7.
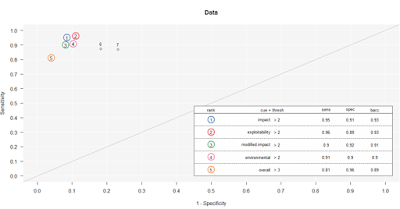
Figure 7: Cue rankings prefer impact and exploitability
The fast and frugal tree made its decision where impact and exploitability with scores equal or less than 2 were non-critical and exploitability greater than 2 was labeled critical, as seen in Figure 8.

Figure 8: The FFT decides
Ah hah! Our FFT sees things differently than our assessor. With a 93% average for performance fitting (this is good), our tree, making decisions on impact and exploitability, decides that there are 444 non-critical findings and 222 critical findings, a 17 point differential from our assessor. Can we all agree that mitigating and remediating critical findings can be an expensive proposition? If you, with just a modicum of data science, can make an authoritative decision that saves you time and money without adversely impacting your security posture, would you count it as a win? Yes, that was rhetorical.

Note that the FFTrees function automatically builds several versions of the same general tree that make different error trade-offs with variations in performance fitting and false positives. This gives you the option to test variables and make potentially even more informed decisions within the construct of one model. Ultimately, fast frugal trees make very fast decisions on 1 to 5 pieces of information and ignore all other information. In other words, "FFTrees are noncompensatory, once they make a decision based on a few pieces of information, no additional information changes the decision."

Finally, let's take a look at monitoring user logon anomalies in high volume environments with Time Series Regression (TSR). Much of this work comes courtesy of Eric Kapfhammer, our lead data scientist on our Microsoft Windows and Devices Group Blue Team. The ideal Windows Event ID for such activity is clearly 4624: an account was successfully logged on. This event is typically one of the top 5 events in terms of volume in most environments, and has multiple type codes including Network, Service, and RemoteInteractive.
User accounts will begin to show patterns over time, in aggregate, including:
  • Seasonality: day of week, patch cycles, 
  • Trend: volume of logons increasing/decreasing over time
  • Noise: randomness
You could look at 4624 with a Z-score model, which sets a threshold based on the number of standard deviations away from an average count over a given period of time, but this is a fairly simple model. The higher the value, the greater the degree of “anomalousness”.
Preferably, via Time Series Regression (TSR), your feature set is more rich:
  • Statistical method for predicting a future response based on the response history (known as autoregressive dynamics) and the transfer of dynamics from relevant predictors
  • Understand and predict the behavior of dynamic systems from experimental or observational data
  • Commonly used for modeling and forecasting of economic, financial and biological systems
How to spot the anomaly in a sea of logon data?
Let's imagine our user, DARPA-549521, in the SUPERSECURE domain, with 90 days of aggregate 4624 Type 10 events by day.

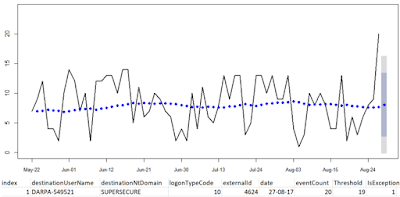
Figure 9: User logon data
With 210 line of R, including comments, log read, file output, and graphing we can visualize and alert on DARPA-549521's data as seen in Figure 10

Figure 10: User behavior outside the confidence interval
We can detect when a user’s account exhibits  changes in their seasonality as it relates to a confidence interval established (learned) over time. In this case, on 27 AUG 2017, the user topped her threshold of 19 logons thus triggering an exception. Now imagine using this model to spot anomalous user behavior across all users and you get a good feel for the model's power.
Eric points out that there are, of course, additional options for modeling including:
  • Seasonal and Trend Decomposition using Loess (STL)
    • Handles any type of seasonality ~ can change over time
    • Smoothness of the trend-cycle can also be controlled by the user
    • Robust to outliers
  • Classification and Regression Trees (CART)
    • Supervised learning approach: teach trees to classify anomaly / non-anomaly
    • Unsupervised learning approach: focus on top-day hold-out and error check
  • Neural Networks
    • LSTM / Multiple time series in combination
These are powerful next steps in your capabilities, I want you to be brave, be creative, go forth and add elements of data science and visualization to your practice. R and Python are well supported and broadly used for this mission and can definitely help you detect attackers faster, contain incidents more rapidly, and enhance your in-house detection and remediation mechanisms.
All the code as I can share is here; sorry, I can only share the TSR example without the source.
All the best in your endeavors!
Cheers...until next time.

Tuesday, October 17, 2017

McRee added to ISSA's Honor Roll for Lifetime Achievement

HolisticInfoSec's Russ McRee was pleased to be added to ISSA International's Honor Roll this month, a lifetime achievement award recognizing an individual's sustained contributions to the information security community, the advancement of the association and enhancement of the professionalism of the membership.
According to the press release:
"Russ McRee has a strong history in the information security as a teacher, practitioner and writer. He is responsible for 107 technical papers published in the ISSA Journal under his Toolsmith byline in 2006-2015. These articles represent a body of knowledge for the hands-on practitioner that is second to none. These titles span an extremely wide range of deep network security topics. Russ has been an invited speaker at the key international computer security venues including DEFCON, Derby Con, BlueHat, Black Hat, SANSFIRE, RSA, and ISSA International."
Russ greatly appreciates this honor and would like to extend congratulations to the ten other ISSA 2017 award winners. Sincere gratitude to Briana and Erin McRee, Irvalene Moni, Eric Griswold, Steve Lynch, and Thom Barrie for their extensive support over these many years.

toolsmith #128 - DFIR Redefined: Deeper Functionality for Investigators with R - Part 1

“To competently perform rectifying security service, two critical incident response elements are necessary: information and organization.” ~ Robert E. Davis

I've been presenting DFIR Redefined: Deeper Functionality for Investigators with R across the country at various conference venues and thought it would helpful to provide details for readers.
The basic premise?
Incident responders and investigators need all the help they can get.
Let me lay just a few statistics on you, from Secure360.org's The Challenges of Incident Response, Nov 2016. Per their respondents in a survey of security professionals:
  • 38% reported an increase in the number of hours devoted to incident response
  • 42% reported an increase in the volume of incident response data collected
  • 39% indicated an increase in the volume of security alerts
In short, according to Nathan Burke, “It’s just not mathematically possible for companies to hire a large enough staff to investigate tens of thousands of alerts per month, nor would it make sense.”
The 2017 SANS Incident Response Survey, compiled by Matt Bromiley in June, reminds us that “2016 brought unprecedented events that impacted the cyber security industry, including a myriad of events that raised issues with multiple nation-state attackers, a tumultuous election and numerous government investigations.” Further, "seemingly continuous leaks and data dumps brought new concerns about malware, privacy and government overreach to the surface.”
Finally, the survey shows that IR teams are:
  • Detecting the attackers faster than before, with a drastic improvement in dwell time
  • Containing incidents more rapidly
  • Relying more on in-house detection and remediation mechanisms
To that end, what concepts and methods further enable handlers and investigators as they continue to strive for faster detection and containment? Data science and visualization sure can’t hurt. How can we be more creative to achieve “deeper functionality”? I propose a two-part series on Deeper Functionality for Investigators with R with the following DFIR Redefined scenarios:
  • Have you been pwned?
  • Visualization for malicious Windows Event Id sequences
  • How do your potential attackers feel, or can you identify an attacker via sentiment analysis?
  • Fast Frugal Trees (decision trees) for prioritizing criticality
R is “100% focused and built for statistical data analysis and visualization” and “makes it remarkably simple to run extensive statistical analysis on your data and then generate informative and appealing visualizations with just a few lines of code.”

With R you can interface with data via file ingestion, database connection, APIs and benefit from a wide range of packages and strong community investment.
From the Win-Vector Blog, per John Mount “not all R users consider themselves to be expert programmers (many are happy calling themselves analysts). R is often used in collaborative projects where there are varying levels of programming expertise.”
I propose that this represents the vast majority of us, we're not expert programmers, data scientists, or statisticians. More likely, we're security analysts re-using code for our own purposes, be it red team or blue team. With a very few lines of R investigators might be more quickly able to reach conclusions.
All the code described in the post can be found on my GitHub.

Have you been pwned?

This scenario I covered in an earlier post, I'll refer you to Toolsmith Release Advisory: Steph Locke's HIBPwned R package.

Visualization for malicious Windows Event Id sequences

Windows Events by Event ID present excellent sequenced visualization opportunities. A hypothetical scenario for this visualization might include multiple failed logon attempts (4625) followed by a successful logon (4624), then various malicious sequences. A fantastic reference paper built on these principle is Intrusion Detection Using Indicators of Compromise Based on Best Practices and Windows Event Logs. An additional opportunity for such sequence visualization includes Windows processes by parent/children. One R library particularly well suited to is TraMineR: Trajectory Miner for R. This package is for mining, describing and visualizing sequences of states or events, and more generally discrete sequence data. It's primary aim is the analysis of biographical longitudinal data in the social sciences, such as data describing careers or family trajectories, and a BUNCH of other categorical sequence data. Somehow though, the project page somehow fails to mention malicious Windows Event ID sequences. :-) Consider Figures 1 and 2 as retrieved from above mentioned paper. Figure 1 are text sequence descriptions, followed by their related Windows Event IDs in Figure 2.

Figure 1
Figure 2
Taking related log data, parsing and counting it for visualization with R would look something like Figure 3.

Figure 3
How much R code does it take to visualize this data with a beautiful, interactive sunburst visualization? Three lines, not counting white space and comments, as seen in the video below.


A screen capture of the resulting sunburst also follows as Figure 4.

Figure 4


How do your potential attackers feel, or can you identify an attacker via sentiment analysis?

Do certain adversaries or adversarial communities use social media? Yes
As such, can social media serve as an early warning system, if not an actual sensor? Yes
Are certain adversaries, at times, so unaware of OpSec on social media that you can actually locate them or correlate against other geo data? Yes
Some excellent R code to assess Twitter data with includes Jeff Gentry's twitteR and rtweet to interface with the Twitter API.
  • twitteR: provides access to the Twitter API. Most functionality of the API is supported, with a bias towards API calls that are more useful in data analysis as opposed to daily interaction.
  • Rtweet: R client for interacting with Twitter’s REST and stream API’s.
The code and concepts here are drawn directly from Michael Levy, PhD UC Davis: Playing With Twitter.
Here's the scenario: DDoS attacks from hacktivist or chaos groups.
Attacker groups often use associated hashtags and handles and the minions that want to be "part of" often retweet and use the hashtag(s). Individual attackers either freely give themselves away, or often become easily identifiable or associated, via Twitter. As such, here's a walk-through of analysis techniques that may help identify or better understand the motives of certain adversaries and adversary groups. I don't use actual adversary handles here, for obvious reasons. I instead used a DDoS news cycle and journalist/bloggers handles as exemplars. For this example I followed the trail of the WireX botnet, comprised mainly of Android mobile devices utilized to launch a high-impact DDoS extortion campaign against multiple organizations in the travel and hospitality sector in August 2017. I started with three related hashtags: 
  1. #DDOS 
  2. #Android 
  3. #WireX
We start with all related Tweets by day and time of day. The code is succinct and efficient, as noted in Figure 5.

Figure 5
The result is a pair of graphs color coded by tweets and retweets per Figure 6.

Figure 6

This gives you an immediate feels for spikes in interest by day as well as time of day, particularly with attention to retweets.
Want to see what platforms potential adversaries might be tweeting from? No problem, code in Figure 7.
Figure 7

The result in the scenario ironically indicates that the majority of related tweets using our hashtags of interest are coming from Androids per Figure 8. :-)


Figure 8
Now to the analysis of emotional valence, or the "the intrinsic attractiveness (positive valence) or averseness (negative valence) of an event, object, or situation."
orig$text[which.max(orig$emotionalValence)] tells us that the most positive tweet is "A bunch of Internet tech companies had to work together to clean up #WireX #Android #DDoS #botnet."
orig$text[which.min(orig$emotionalValence)] tells us that "Dangerous #WireX #Android #DDoS #Botnet Killed by #SecurityGiants" is the most negative tweet.
Interesting right? Almost exactly the same message, but very different valence.
How do we measure emotional valence changes over the day? Four lines later...
filter(orig, mday(created) == 29) %>%
  ggplot(aes(created, emotionalValence)) +
  geom_point() + 
  geom_smooth(span = .5)
...and we have Figure 9, which tell us that most tweets about WireX were emotionally neutral on 29 AUG 2017, around 0800 we saw one positive tweet, a more negative tweets overall in the morning.

Figure 9
Another line of questioning to consider: which tweets are more often retweeted, positive or negative? As you can imagine with information security focused topics, negativity wins the day.
Three lines of R...
ggplot(orig, aes(x = emotionalValence, y = retweetCount)) +
  geom_point(position = 'jitter') +
  geom_smooth()
...and we learn just how popular negative tweets are in Figure 10.

Figure 10
There are cluster of emotionally neutral retweets, two positive retweets, and a load of negative retweets. This type of analysis can quickly lead to a good feel for the overall sentiment of an attacker collective, particularly one with less opsec and more desire for attention via social media.
In Part 2 of DFIR Redefined: Deeper Functionality for Investigators with R we'll explore this scenario further via sentiment analysis and Twitter data, as well as Fast Frugal Trees (decision trees) for prioritizing criticality.
Let me know if you have any questions on the first part of this series via @holisticinfosec or russ at holisticinfosec dot org.
Cheers...until next time. 

Sunday, September 10, 2017

Toolsmith Tidbit: Windows Auditing with WINspect

WINSpect recently hit the toolsmith radar screen via Twitter, and the author, Amine Mehdaoui, just posted an update a couple of days ago, so no time like the present to give you a walk-through. WINSpect is a Powershell-based Windows Security Auditing Toolbox. According to Amine's GitHub README, WINSpect "is part of a larger project for auditing different areas of Windows environments. It focuses on enumerating different parts of a Windows machine aiming to identify security weaknesses and point to components that need further hardening. The main targets for the current version are domain-joined windows machines. However, some of the functions still apply for standalone workstations."
The current script feature set includes audit checks and enumeration for:

  • Installed security products
  • World-exposed local filesystem shares
  • Domain users and groups with local group membership
  • Registry autoruns
  • Local services that are configurable by Authenticated Users group members
  • Local services for which corresponding binary is writable by Authenticated Users group members
  • Non-system32 Windows Hosted Services and their associated DLLs
  • Local services with unquoted path vulnerability
  • Non-system scheduled tasks
  • DLL hijackability
  • User Account Control settings
  • Unattended installs leftovers
I can see this useful PowerShell script coming in quite handy for assessment using the CIS Top 20 Security Controls. I ran it on my domain-joined Windows 10 Surface Book via a privileged PowerShell and liked the results.


The script confirms that it's running with admin rights, checks PowerShell version, then inspects Windows Firewall settings. Looking good on the firewall, and WINSpect tees right off on my Window Defender instance and its configuration as well.
Not sharing a screenshot of my shares or admin users, sorry, but you'll find them enumerated when you run WINSpect.


 WINSpect then confirmed that UAC was enabled, and that it should notify me only apps try to make changes, then checked my registry for autoruns; no worries on either front, all confirmed as expected.


WINSpect wrapped up with a quick check of configurable services, SMSvcHost is normal as part of .NET, even if I don't like it, but the flowExportService doesn't need to be there at all, I removed that a while ago after being really annoyed with it during testing. No user hosted services, and DLL Safe Search is enable...bonus. Finally, no unattended install leftovers, and all the scheduled tasks are normal for my system. Sweet, pretty good overall, thanks WINSpect. :-)

Give it a try for yourself, and keep an eye out for updates. Amine indicates that Local Security Policy controls, administrative shares configs, loaded DLLs, established/listening connections, and exposed GPO scripts on the to-do list. 
Cheers...until next time.

Monday, August 28, 2017

Toolsmith Release Advisory: Magic Unicorn v2.8

David Kennedy and the TrustedSec crew have released Magic Unicorn v2.8.
Magic Unicorn is "a simple tool for using a PowerShell downgrade attack and inject shellcode straight into memory, based on Matthew Graeber's PowerShell attacks and the PowerShell bypass technique presented by Dave and Josh Kelly at Defcon 18.

Version 2.8:
  • shortens length and obfuscation of unicorn command
  • removes direct -ec from PowerShell command
Usage:
"Usage is simple, just run Magic Unicorn (ensure Metasploit is installed and in the right path) and Magic Unicorn will automatically generate a PowerShell command that you need to simply cut and paste the PowerShell code into a command line window or through a payload delivery system."


Wednesday, August 16, 2017

Toolsmith #127: OSINT with Datasploit

I was reading an interesting Motherboard article, Legal Hacking Tools Can Be Useful for Journalists, Too, that includes reference to one of my all time OSINT favorites, Maltego. Joseph Cox's article also mentions Datasploit, a 2016 favorite for fellow tools aficionado, Toolswatch.org, see 2016 Top Security Tools as Voted by ToolsWatch.org Readers. Having not yet explored Datasploit myself, this proved to be a grand case of "no time like the present."
Datasploit is "an #OSINT Framework to perform various recon techniques, aggregate all the raw data, and give data in multiple formats." More specifically, as stated on Datasploit documentation page under Why Datasploit, it utilizes various Open Source Intelligence (OSINT) tools and techniques found to be effective, and brings them together to correlate the raw data captured, providing the user relevant information about domains, email address, phone numbers, person data, etc. Datasploit is useful to collect relevant information about target in order to expand your attack and defense surface very quickly.
The feature list includes:
  • Automated OSINT on domain / email / username / phone for relevant information from different sources
  • Useful for penetration testers, cyber investigators, defensive security professionals, etc.
  • Correlates and collaborate results, shows them in a consolidated manner
  • Tries to find out credentials,  API keys, tokens, sub-domains, domain history, legacy portals, and more as related to the target
  • Available as single consolidating tool as well as standalone scripts
  • Performs Active Scans on collected data
  • Generates HTML, JSON reports along with text files
Resources
Github: https://github.com/datasploit/datasploit
Documentation: http://datasploit.readthedocs.io/en/latest/
YouTube: Quick guide to installation and use

Pointers
Second, a few pointers to keep you from losing your mind. This project is very much work in progress, lots of very frustrated users filing bugs and wondering where the support is. The team is doing their best, be patient with them, but read through the Github issues to be sure any bugs you run into haven't already been addressed.
1) Datasploit does not error gracefully, it just crashes. This can be the result of unmet dependencies or even a missing API key. Do not despair, take note, I'll talk you through it.
2) I suggest, for ease, and best match to documentation, run Datasploit from an Ubuntu variant. Your best bet is to grab Kali, VM or dedicated and load it up there, as I did.
3) My installation guidance and recommendations should hopefully get you running trouble free, follow it explicitly.
4) Acquire as many API keys as possible, see further detail below.

Installation and preparation
From Kali bash prompt, in this order:

  1. git clone https://github.com/datasploit/datasploit /etc/datasploit
  2. apt-get install libxml2-dev libxslt-dev python-dev lib32z1-dev zlib1g-dev
  3. cd /etc/datasploit
  4. pip install -r requirements.txt
  5. mv config_sample.py config.py
  6. With your preferred editor, open config.py and add API keys for the following at a minimum, they are, for all intents and purposes required, detailed instructions to acquire each are here:
    1. Shodan API
    2. Censysio ID and Secret
    3. Clearbit API
    4. Emailhunter API
    5. Fullcontact API
    6. Google Custom Search Engine API key and CX ID
    7. Zoomeye Username and Password
If, and only if, you've done all of this correctly, you might end up with a running instance of Datasploit. :-) Seriously, this is some of the glitchiest software I've tussled with in quite a while, but the results paid handsomely. Run python datasploit.py domain.com, where domain.com is your target. Obviously, I ran python datasploit.py holisticinfosec.org to acquire results pertinent to your author. 
Datasploit rapidly pulled results as follows:
211 domain references from Github:
Github results
Luckily, no results from Shodan. :-)
Four results from Paste(s): 
Pastebin and Pastie results
Datasploit pulled russ at holisticinfosec dot org as expected, per email harvesting.
Accurate HolisticInfoSec host location data from Zoomeye:

Details regarding HolisticInfoSec sub-domains and page links:
Sub-domains and page links
Finally, a good return on DNS records for holisticinfosec.org and, thankfully, no vulns found via PunkSpider

DataSploit can also be integrated into other code and called as individual scripts for unique functions. I did a quick run with python emailOsint.py russ@holisticinfosec.org and the results were impressive:
Email OSINT
I love that the first query is of Troy Hunt's Have I Been Pwned. Not sure if you have been? Better check it out. Reminder here, you'll really want to be sure to have as many API keys as possible or you may find these buggy scripts crashing. You'll definitely find yourself compromising between frustration and the rapid, detailed results. I put this offering squarely in the "shows much promise category" if the devs keep focus on it, assess for quality, and handle errors better.
Give Datasploit a try for sure.
Cheers, until next time...

Friday, July 07, 2017

Toolsmith #126: Adversary hunting with SOF-ELK

As we celebrate Independence Day, I'm reminded that we honor what was, of course, an armed conflict. Today's realities, when we think about conflict, are quite different than the days of lining troops up across the field from each other, loading muskets, and flinging balls of lead into the fray.
We live in a world of asymmetrical battles, often conflicts that aren't always obvious in purpose and intent, and likely fought on multiple fronts. For one of the best reads on the topic, take the well spent time to read TJ O'Connor's The Jester Dynamic: A Lesson in Asymmetric Unmanaged Cyber Warfare. If you're reading this post, it's highly likely that your front is that of 1s and 0s, either as a blue team defender, or as a red team attacker. I live in this world every day of my life as a blue teamer at Microsoft, and as a joint forces cyber network operator. We are faced, each day, with overwhelming, excessive amounts of data, of varying quality, where the answers to questions are likely hidden, but available to those who can dig deeply enough.
New platforms continue to emerge to help us in this cause. At Microsoft we have a variety of platforms that make the process easier for us, but no less arduous, to dig through the data, and the commercial sector continues to expand its offerings. For those with limited budgets and resources, but a strong drive for discovery, that have been outstanding offerings as well. Security Onion has been forefront for years, and is under constant development and improvement in the care of Doug Burks.
Another emerging platform, to be discussed here, is SOF-ELK, part of the SANS Forensics community, created by SANS FOR572, Advanced Network Forensics and Analysis author and instructor Phil Hagen. Count SOF-ELK in the NFAT family for sure, a strong player in the Network Forensic Analysis Tool category.
SOF-ELK has a great README, don't be that person, read it. It's everything you need to get started, in one place. What!? :-)
Better yet, you can download a fully realized VM with almost no configuration requirements, so you can hit the ground running. I ran my SOF-ELK instance with VMWare Workstation 12 Pro and no issues other than needing to temporarily disable Device Guard and Credential Guard on Windows 10.
SOF-ELK offers some good test data to get you started with right out of the gate, in /home/elk_user/exercise_source_logs, including Syslog from a firewall, router, converted Windows events, a Squid proxy, and a server named muse. You can drop these on your SOF-ELK server in the /logstash/syslog/ ingestion point for syslog-formatted data. Additionally, utilize /logstash/nfarch/ for archived NetFlow output, /logstash/httpd/ for Apache logs, /logstash/passivedns/ for logs from the passivedns utility, /logstash/plaso/ for log2timeline, and  /logstash/bro/ for, yeah, you guessed it.
I mixed things up a bit and added my own Apache logs for the month of May to /logstash/httpd/. The muse log set in the exercise offering also included a DNS log (named_log), for grins I threw that in the /logstash/syslog/ as well just to see how it would play.
Run down a few data rabbit holes with me, I swear I can linger for hours on end once I latch on to something to chase. We'll begin with a couple of highlights from my Apache logs. The SOF-ELK VM comes with three pre-configured dashboards including Syslog, NetFlow, and HTTPD. You can learn more in the start page for the SOF-ELK UI, my instance is http://192.168.50.110:5601/app/kibana. There are three panels, or blocks, for each dashboard's details, at the bottom of the UI. I drilled through to the HTTPD Log Dashboard for this experiment, and immediately reset the time period for analysis (click the time marker in the upper right hand part of the UI). It defaults to the last 15 minutes, if you're reviewing older data it won't show until you adjust to match your time stamps. My data is from the month of May so I selected an absolute window from the beginning of May to its end. You can also select quick or relative time options, it's great to get comfortable here quickly and early. The resulting opening visualizations for me made me very happy, as seen in Figure 1.
Figure 1: HTTPD Log Dashboard
Nice! An event count summary, source ASNs by count (you can immediately see where I scanned myself from work), a fantastic Access Source map, a records graph by HTTP verbs, and one by response codes.
The beauty of these SOF-ELK dashboards is that they're immediately interactive and allow you to drill right in to interesting data points. The holisticinfosec.org website is intentionally flat and includes no active PHP or dynamic content. As a result, my favorite response code as a web application security tester, the 500 error, is notably missing. But, in both the timeline graphs we note a big traffic spike on 8 MAY 2017, which correlates nicely with my above mention scan from work, as noted in the ASN hit count, and seen here in Figure 2.

Figure 2: Traffic spike from scan
This visualizes well but isn't really all that interesting or uncommon, particularly given that I know I personally ran the scan, and scans from the Intarwebs are dime a dozen. What did jump out for me though, as seen back in Figure 1, was the presence of four PUT requests. That's usually a "bad thing" where some @$$h@t is trying to drop something on my server. Let's drill in a bit, shall we? After clicking the graph line with the four PUT requests, I quickly learned that two requests came from 204.12.194.234 AS32097: WholeSale Internet in Kansas City, MO and two came from 119.23.233.9 AS37963: Hangzhou Alibaba Advertising in Hangzhou, China. This is well represented in the HTTPD Access Source panel map (Figure 3).

Figure 3: Access Source
The PUT request from each included a txt file attempt, specifically dbhvf99151.txt and htjfx99555.txt, both were rejected, redirected (302), and sent to my landing page (200).
Research on the IPs found that 119.23.233.9 was on the "real time suspected malware list as detected by InterServer's intrusion systems" as seen 22 MAY, and 204.12.194.234 was found twice in the AbuseIPDB, flagged on 18 MAY 2017 for Cknife Webshell Detected. Now we're talking. It's common to attempt a remote file include attack or a PUT, with what is a web shell. I opened up SOF-ELK on that IP address and found eight total hits in my logs, all looking for common PHP opportunities with the likes of GET and POST for /plus/mytag_js.php, noted in PHP injection attack attempts.
SOF-ELK made it incredibly easy to hunt down these details, as seen in Figure 4 from the HTTPD Discovery panel.
Figure 4: Discovery
That's a groovy little hunting trip through HTTPD logs, but how about a bit of Syslog? I spotted I likely oddity that could be correlated across a number of the exercise logs, we'll see if the correlation is real. You'll notice tabs at the top of your SOF-ELK UI, we'll use Discover for this experiment. I started from the Syslog Dashboard with my time range set broadly on the last two months. 7606 records presented themselves, sliced neatly by hosts and programs, as seen in Figure 5.

Figure 5: Syslog Dashboard
Squid proxy logs showed the predominance of host entries (6778 or 57.95% of 11,696 to be specific), so I started there. Don' laugh, but I'll often do keyword queries just to see what comes up, sometimes you land a pointer to a good rabbit hole. Within the body of 6778 proxy events, I searched malware. Two hits came back for GET request via a JS redirector to bleepingcomputer.com for your basic how-to based on "random websites opening in Chrome". Ruh-roh.
Figure 6: Malware keyword
More importantly, we have an IP address to pivot on: 10.3.59.53. A search of that IP across the same 6778 Squid logs yielded 3896 entries specific to this IP, and lots to be curious about:
  • datingukrainewomen.com 
  • anastasiadate.com
  • YouTube videos for hair loss
  • crowdscience.com for "random pop-ups driving me nuts"
Do I need to build this user profile out for you, or are you with me? Proxy logs tell us so much, and are deeply worthy of your blue team efforts to collect and review.
I jumped over to the named_log from the muse host to see what else might reveal itself. Here's where I jumped to Discover, the Splunk-like query functionality inherent to SOF-ELK (and ELK implemetations). I did reductive query to see what other oddities might surface: 10.3.59.53 AND dns_query: (*.co.uk OR *.de OR *.eu OR *.info OR *.cc OR *.online OR *.website). I used these TLDs based on the premise that bots using Domain Generation Algorithms (DGA) will often use the TLDs. See The DGA of PadCrypt to learn more, as well as ISC Diary handler John Bambanek's OSINT logic. The query results were quite satisfying, 29 hits, including a number of clearly randomly generated domains. Those that were most interesting all included the .cc TLD, so I zoomed in further. Down to five hits with 10.3.59.53 AND dns_query: *.cc, as seen in Figure 7.
Figure 7:. CC TLD hits
Oh man, not good. I had a hunch now, and went back to the proxy logs with 10.3.59.53 AND squid_request:*.exe. And there you have it, ladies and gentlemen, hunch rewarded (Figure 8).

Figure 8: taxdocs.exe
It taxdocs.exe isn't malware, I'm a monkey's uncle. Unfortunately, I could find no online references to these .cc domains or the .exe sample or URL, but you get the point. Given that it's exercise data, Phil may have generated it to entice to dig deeper.
When we think about the IOC patterns for Petya, a hunt like this is pretty revealing. Petya's "initial infection appears to involve a software supply-chain threat involving the Ukrainian company M.E.Doc, which develops tax accounting software, MEDoc". This is not Petya (as far as I know) specifically but we see pattern similarities for sure, one can learn a great deal about the sheep and the wolves. Be the sheepdog!
Few tools better in the free and open source arsenal to help you train and enhance your inner digital sheepdog than SOF-ELK. "I'm a sheepdog. I live to protect the flock and confront the wolf." ~ LTC Dave Grossman, from On Combat.

Believe it or not, there's a ton more you can do with SOF-ELK, consider this a primer and a motivator.
I LOVE SOF-ELK. Phil, well done, thank you. Readers rejoice, this is really one of my favorites for toolsmith, hands down, out of the now 126 unique tools discussed over more than ten years. Download the VM, and get to work herding. :-)
Cheers...until next time.

Sunday, May 21, 2017

Toolsmith #125: ZAPR - OWASP ZAP API R Interface

It is my sincere hope that when I say OWASP Zed Attack Proxy (ZAP), you say "Hell, yeah!" rather than "What's that?". This publication has been a longtime supporter, and so many brilliant contibutors and practitioners have lent to OWASP ZAPs growth, in addition to @psiinon's extraordinary project leadership. OWASP ZAP has been 1st or 2nd in the last four years of @ToolsWatch best tool survey's for a damned good reason. OWASP ZAP usage has been well documented and presented over the years, and the wiki gives you tons to consider as you explore OWASP ZAP user scenarios.
One of the more recent scenarios I've sought to explore recently is use of the OWASP ZAP API. The OWASP ZAP API is also well documented, more than enough detail to get you started, but consider a few use case scenarios.
First, there is a functional, clean OWASP ZAP API UI, that gives you a viewer's perspective as you contemplate programmatic opportunities. OWASP ZAP API interaction is URL based, and you can invoke both access views and invoke actions. Explore any component and you'll immediately find related views or actions. Drilling into to core via http://localhost:8067/UI/core/ (I run OWASP ZAP on 8067, your install will likely be different), gives me a ton to choose from.
You'll need your API key in order to build queries. You can find yours via Tools | Options | API | API Key. As an example, drill into numberOfAlerts (baseurl ), which gets the number of alerts, optionally filtering by URL. You'll then be presented with the query builder, where you can enter you key, define specific parameter, and decide your preferred output format including JSON, HTML, and XML.
Sure, you'll receive results in your browser, this query will provide answers in HTML tables, but these aren't necessarily optimal for programmatic data consumption and manipulation. That said, you learn the most important part of this lesson, a fully populated OWASP ZAP API GET URL: http://localhost:8067/HTML/core/view/numberOfAlerts/?zapapiformat=HTML&apikey=2v3tebdgojtcq3503kuoq2lq5g&formMethod=GET&baseurl=.
This request would return


in HTML. Very straightforward and easy to modify per your preferences, but HTML results aren't very machine friendly. Want JSON results instead? Just swap  out HTML with JSON in the URL, or just choose JSON in the builder. I'll tell you than I prefer working with JSON when I use the OWASP ZAP API via the likes of R. It's certainly the cleanest, machine-consumable option, though others may argue with me in favor of XML.
Allow me to provide you an example with which you can experiment, one I'll likely continue to develop against as it's kind of cool for active reporting on OWASP ZAP scans in flight or on results when session complete. Note, all my code, crappy as it may be, is available for you on GitHub. I mean to say, this is really v0.1 stuff, so contribute and debug as you see fit. It's also important to note that OWASP ZAP needs to be running, either with an active scanning session, or a stored session you saved earlier. I scanned my website, holisticinfosec.org, and saved the session for regular use as I wrote this. You can even see reference to the saved session by location below.
R users are likely aware of Shiny, a web application framework for R, and its dashboard capabilities. I also discovered that rCharts are designed to work interactively and beautifully within Shiny.
R includes packages that make parsing from JSON rather straightforward, as I learned from Zev Ross. RJSONIO makes it as easy as fromJSON("http://localhost:8067/JSON/core/view/alerts/?zapapiformat=JSON&apikey=2v3tebdgojtcq3503kuoq2lq5g&formMethod=GET&baseurl=&start=&count=")
to pull data from the OWASP ZAP API. We use the fromJSON "function and its methods to read content in JSON format and de-serializes it into R objects", where the ZAP API URL is that content.
I further parsed alert data using Zev's grabInfo function and organized the results into a data frame (ZapDataDF). I then further sorted the alert content from ZapDataDF into objects useful for reporting and visualization. Within each alert objects are values such as the risk level, the alert message, the CWE ID, the WASC ID, and the Plugin ID. Defining each of these values into parameter useful to R is completed with the likes of:
I then combined all those results into another data frame I called reportDF, the results of which are seen in the figure below.
reportDF results
Now we've got some content we can pivot on.
First, let's summarize the findings and present them in their resplendent glory via ZAPR: OWASP ZAP API R Interface.
Code first, truly simple stuff it is:
Summary overview API calls

You can see that we're simply using RJSONIO's fromJSON to make specific ZAP API call. The results are quite tidy, as seen below.
ZAPR Overview
One of my favorite features in Shiny is the renderDataTable function. When utilized in a Shiny dashboard, it makes filtering results a breeze, and thus is utilized as the first real feature in ZAPR. The code is tedious, review or play with it from GitHub, but the results should speak for themselves. I filtered the view by CWE ID 89, which in this case is a bit of a false positive, I have a very flat web site, no database, thank you very much. Nonetheless, good to have an example of what would definitely be a high risk finding.


Alert filtering

Alert filtering is nice, I'll add more results capabilities as I develop this further, but visualizations are important too. This is where rCharts really come to bear in Shiny as they are interactive. I've used the simplest examples, but you'll get the point. First, a few, wee lines of R as seen below.
Chart code
The results are much more satisfying to look at, and allow interactivity. Ramnath Vaidyanathan has done really nice work here. First, OWASP ZAP alerts pulled via the API are counted by risk in a bar chart.
Alert counts

As I moused over Medium, we can see that there were specifically 17 results from my OWASP ZAP scan of holisticinfosec.org.
Our second visualization are the CWE ID results by count, in an oft disdained but interactive pie chart (yes, I have some work to do on layout).


CWE IDs by count

As we learned earlier, I only had one CWE ID 89 hit during the session, and the visualization supports what we saw in the data table.
The possibilities are endless to pull data from the OWASP ZAP API and incorporate the results into any number of applications or report scenarios. I have a feeling there is a rich opportunity here with PowerBI, which I intend to explore. All the code is here, along with the OWASP ZAP session I refer to, so you can play with it for yourself. You'll need OWASP ZAP, R, and RStudio to make it all work together, let me know if you have questions or suggestions.
Cheers, until next time.

Moving blog to HolisticInfoSec.io

toolsmith and HolisticInfoSec have moved. I've decided to consolidate all content on one platform, namely an R markdown blogdown sit...