Showing posts with label logstash. Show all posts

Friday, July 07, 2017

Toolsmith #126: Adversary hunting with SOF-ELK

As we celebrate Independence Day, I'm reminded that we honor what was, of course, an armed conflict. Today's realities, when we think about conflict, are quite different than the days of lining troops up across the field from each other, loading muskets, and flinging balls of lead into the fray.
We live in a world of asymmetrical battles, often conflicts that aren't always obvious in purpose and intent, and likely fought on multiple fronts. For one of the best reads on the topic, take the well spent time to read TJ O'Connor's The Jester Dynamic: A Lesson in Asymmetric Unmanaged Cyber Warfare. If you're reading this post, it's highly likely that your front is that of 1s and 0s, either as a blue team defender, or as a red team attacker. I live in this world every day of my life as a blue teamer at Microsoft, and as a joint forces cyber network operator. We are faced, each day, with overwhelming, excessive amounts of data, of varying quality, where the answers to questions are likely hidden, but available to those who can dig deeply enough.
New platforms continue to emerge to help us in this cause. At Microsoft we have a variety of platforms that make the process easier for us, but no less arduous, to dig through the data, and the commercial sector continues to expand its offerings. For those with limited budgets and resources, but a strong drive for discovery, that have been outstanding offerings as well. Security Onion has been forefront for years, and is under constant development and improvement in the care of Doug Burks.
Another emerging platform, to be discussed here, is SOF-ELK, part of the SANS Forensics community, created by SANS FOR572, Advanced Network Forensics and Analysis author and instructor Phil Hagen. Count SOF-ELK in the NFAT family for sure, a strong player in the Network Forensic Analysis Tool category.
SOF-ELK has a great README, don't be that person, read it. It's everything you need to get started, in one place. What!? :-)
Better yet, you can download a fully realized VM with almost no configuration requirements, so you can hit the ground running. I ran my SOF-ELK instance with VMWare Workstation 12 Pro and no issues other than needing to temporarily disable Device Guard and Credential Guard on Windows 10.
SOF-ELK offers some good test data to get you started with right out of the gate, in /home/elk_user/exercise_source_logs, including Syslog from a firewall, router, converted Windows events, a Squid proxy, and a server named muse. You can drop these on your SOF-ELK server in the /logstash/syslog/ ingestion point for syslog-formatted data. Additionally, utilize /logstash/nfarch/ for archived NetFlow output, /logstash/httpd/ for Apache logs, /logstash/passivedns/ for logs from the passivedns utility, /logstash/plaso/ for log2timeline, and  /logstash/bro/ for, yeah, you guessed it.
I mixed things up a bit and added my own Apache logs for the month of May to /logstash/httpd/. The muse log set in the exercise offering also included a DNS log (named_log), for grins I threw that in the /logstash/syslog/ as well just to see how it would play.
Run down a few data rabbit holes with me, I swear I can linger for hours on end once I latch on to something to chase. We'll begin with a couple of highlights from my Apache logs. The SOF-ELK VM comes with three pre-configured dashboards including Syslog, NetFlow, and HTTPD. You can learn more in the start page for the SOF-ELK UI, my instance is http://192.168.50.110:5601/app/kibana. There are three panels, or blocks, for each dashboard's details, at the bottom of the UI. I drilled through to the HTTPD Log Dashboard for this experiment, and immediately reset the time period for analysis (click the time marker in the upper right hand part of the UI). It defaults to the last 15 minutes, if you're reviewing older data it won't show until you adjust to match your time stamps. My data is from the month of May so I selected an absolute window from the beginning of May to its end. You can also select quick or relative time options, it's great to get comfortable here quickly and early. The resulting opening visualizations for me made me very happy, as seen in Figure 1.
Figure 1: HTTPD Log Dashboard
Nice! An event count summary, source ASNs by count (you can immediately see where I scanned myself from work), a fantastic Access Source map, a records graph by HTTP verbs, and one by response codes.
The beauty of these SOF-ELK dashboards is that they're immediately interactive and allow you to drill right in to interesting data points. The holisticinfosec.org website is intentionally flat and includes no active PHP or dynamic content. As a result, my favorite response code as a web application security tester, the 500 error, is notably missing. But, in both the timeline graphs we note a big traffic spike on 8 MAY 2017, which correlates nicely with my above mention scan from work, as noted in the ASN hit count, and seen here in Figure 2.

Figure 2: Traffic spike from scan
This visualizes well but isn't really all that interesting or uncommon, particularly given that I know I personally ran the scan, and scans from the Intarwebs are dime a dozen. What did jump out for me though, as seen back in Figure 1, was the presence of four PUT requests. That's usually a "bad thing" where some @$$h@t is trying to drop something on my server. Let's drill in a bit, shall we? After clicking the graph line with the four PUT requests, I quickly learned that two requests came from 204.12.194.234 AS32097: WholeSale Internet in Kansas City, MO and two came from 119.23.233.9 AS37963: Hangzhou Alibaba Advertising in Hangzhou, China. This is well represented in the HTTPD Access Source panel map (Figure 3).

Figure 3: Access Source
The PUT request from each included a txt file attempt, specifically dbhvf99151.txt and htjfx99555.txt, both were rejected, redirected (302), and sent to my landing page (200).
Research on the IPs found that 119.23.233.9 was on the "real time suspected malware list as detected by InterServer's intrusion systems" as seen 22 MAY, and 204.12.194.234 was found twice in the AbuseIPDB, flagged on 18 MAY 2017 for Cknife Webshell Detected. Now we're talking. It's common to attempt a remote file include attack or a PUT, with what is a web shell. I opened up SOF-ELK on that IP address and found eight total hits in my logs, all looking for common PHP opportunities with the likes of GET and POST for /plus/mytag_js.php, noted in PHP injection attack attempts.
SOF-ELK made it incredibly easy to hunt down these details, as seen in Figure 4 from the HTTPD Discovery panel.
Figure 4: Discovery
That's a groovy little hunting trip through HTTPD logs, but how about a bit of Syslog? I spotted I likely oddity that could be correlated across a number of the exercise logs, we'll see if the correlation is real. You'll notice tabs at the top of your SOF-ELK UI, we'll use Discover for this experiment. I started from the Syslog Dashboard with my time range set broadly on the last two months. 7606 records presented themselves, sliced neatly by hosts and programs, as seen in Figure 5.

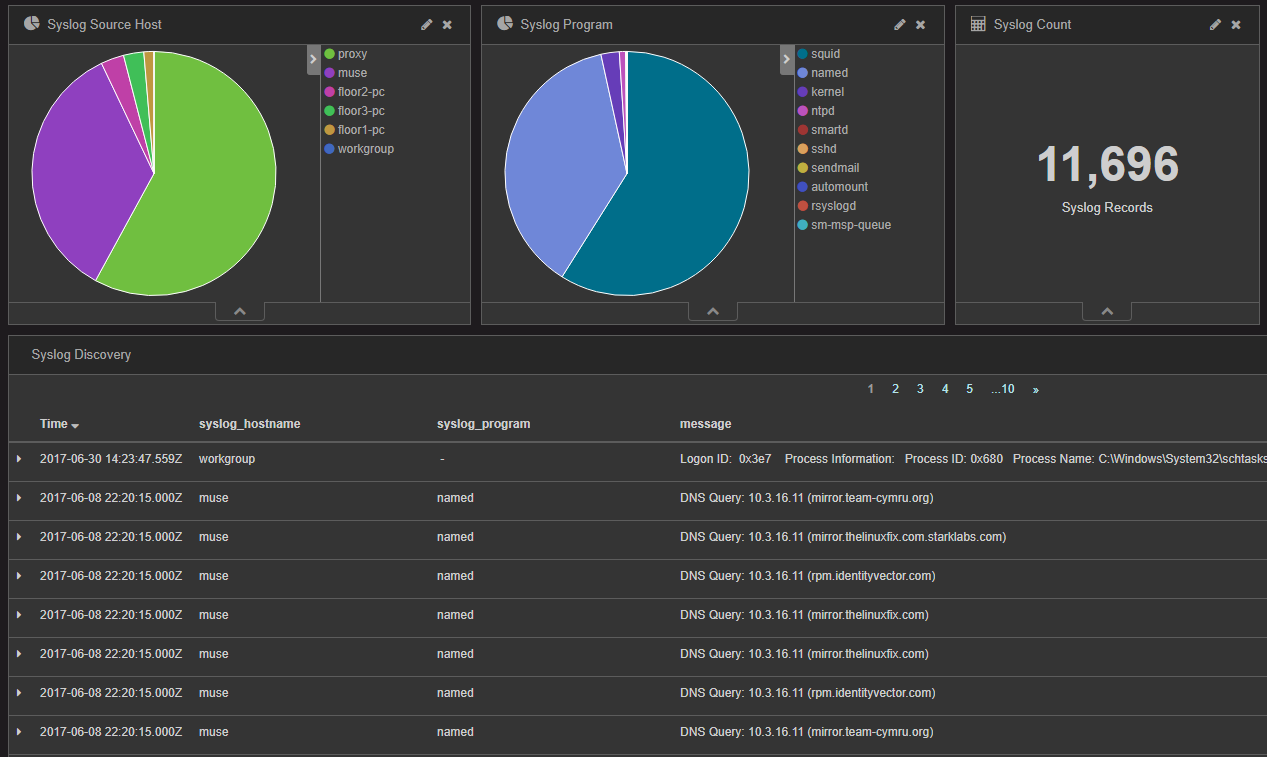
Figure 5: Syslog Dashboard
Squid proxy logs showed the predominance of host entries (6778 or 57.95% of 11,696 to be specific), so I started there. Don' laugh, but I'll often do keyword queries just to see what comes up, sometimes you land a pointer to a good rabbit hole. Within the body of 6778 proxy events, I searched malware. Two hits came back for GET request via a JS redirector to bleepingcomputer.com for your basic how-to based on "random websites opening in Chrome". Ruh-roh.
Figure 6: Malware keyword
More importantly, we have an IP address to pivot on: 10.3.59.53. A search of that IP across the same 6778 Squid logs yielded 3896 entries specific to this IP, and lots to be curious about:
  • datingukrainewomen.com 
  • anastasiadate.com
  • YouTube videos for hair loss
  • crowdscience.com for "random pop-ups driving me nuts"
Do I need to build this user profile out for you, or are you with me? Proxy logs tell us so much, and are deeply worthy of your blue team efforts to collect and review.
I jumped over to the named_log from the muse host to see what else might reveal itself. Here's where I jumped to Discover, the Splunk-like query functionality inherent to SOF-ELK (and ELK implemetations). I did reductive query to see what other oddities might surface: 10.3.59.53 AND dns_query: (*.co.uk OR *.de OR *.eu OR *.info OR *.cc OR *.online OR *.website). I used these TLDs based on the premise that bots using Domain Generation Algorithms (DGA) will often use the TLDs. See The DGA of PadCrypt to learn more, as well as ISC Diary handler John Bambanek's OSINT logic. The query results were quite satisfying, 29 hits, including a number of clearly randomly generated domains. Those that were most interesting all included the .cc TLD, so I zoomed in further. Down to five hits with 10.3.59.53 AND dns_query: *.cc, as seen in Figure 7.
Figure 7:. CC TLD hits
Oh man, not good. I had a hunch now, and went back to the proxy logs with 10.3.59.53 AND squid_request:*.exe. And there you have it, ladies and gentlemen, hunch rewarded (Figure 8).

Figure 8: taxdocs.exe
It taxdocs.exe isn't malware, I'm a monkey's uncle. Unfortunately, I could find no online references to these .cc domains or the .exe sample or URL, but you get the point. Given that it's exercise data, Phil may have generated it to entice to dig deeper.
When we think about the IOC patterns for Petya, a hunt like this is pretty revealing. Petya's "initial infection appears to involve a software supply-chain threat involving the Ukrainian company M.E.Doc, which develops tax accounting software, MEDoc". This is not Petya (as far as I know) specifically but we see pattern similarities for sure, one can learn a great deal about the sheep and the wolves. Be the sheepdog!
Few tools better in the free and open source arsenal to help you train and enhance your inner digital sheepdog than SOF-ELK. "I'm a sheepdog. I live to protect the flock and confront the wolf." ~ LTC Dave Grossman, from On Combat.

Believe it or not, there's a ton more you can do with SOF-ELK, consider this a primer and a motivator.
I LOVE SOF-ELK. Phil, well done, thank you. Readers rejoice, this is really one of my favorites for toolsmith, hands down, out of the now 126 unique tools discussed over more than ten years. Download the VM, and get to work herding. :-)
Cheers...until next time.

Friday, December 20, 2013

Follow up on C3CM: Pt 2 – Bro with Logstash & Kibana (read Applied NSM)

In September I covered using Bro with Logstash and Kibana as part of my C3CM (identify, interrupt, and counter the command, control, and communications capabilities of our digital assailants) series in toolsmith. Two very cool developments have since taken place that justify follow-up:

1) In November Jason Smith (@automayt)  posted Parsing Bro 2.2 Logs with Logstash on the Applied Network Security Monitoring blog. This post exemplifies exactly how to configure Bro with Logstash and Kibana, and includes reference material regarding how to do so with Doug Burk's (@dougburks) Security Onion (@securityonion).

2) Additionally, please help me in congratulating Chris Sanders (@chrissanders88), lead author, along with contributing authors, the above-mentioned Jason Smith, as well as David Bianco (@DavidJBianco)  and Liam Randall (@hectaman),  on the very recent publication of the book the Applied NSM blog supports: Applied Network Security Monitoring: Collection, Detection, and Analysis, also available directly from Syngress.

Chris is indeed a packet ninja, a fellow GSE, and is quite honestly a direct contributor to how I passed that extremely challenging certification. His Practical Packet Analysis: Using Wireshark to Solve Real-World Network Problems is an excellent book and was a significant part of my study and practice for the GSE process. As such, while I have not yet read it, I am quite confident that Applied Network Security Monitoring: Collection, Detection, and Analysis will be of great benefit to all who purchase and read it. Let me be more clear, at the risk of coming off as an utter fanboy. I read Chris' Practical Packet Analysis as part of my studies for GSE | passed GSE as part of STI graduate school requirements | finished graduate school. :-)
Congratulations, Chris and team, well done, and thank you.

Merry Christmas all, and cheers.

Monday, September 02, 2013

C3CM: Part 2 – Bro with Logstash and Kibana

Prerequisites
Linux OS –Ubuntu Desktop 12.04 LTS discussed herein

Introduction
In Part 1 of our C3CM discussion we established that, when applied to the practice of combating bots and APTs, C3CM can be utilized to identify, interrupt, and counter the command, control, and communications capabilities of our digital assailants. 
Where, in part one of this three part series, we utilized Nfsight with Nfdump, Nfsen, and fprobe to conduct our identification phase, we’ll use Bro, Logstash, and Kibana as part of our interrupt phase. Keep in mind that while we’re building our own Ubuntu system to conduct our C3CM activities you can perform much of this work from Doug Burks' outstanding Security Onion (SO). You’ll have to add some packages such as those we did for Part 1, but Bro as described this month is all ready to go on SO. Candidly, I’d be using SO for this entire series if I hadn't already covered it in toolsmith, but I’m also a firm believer in keeping the readership’s Linux foo strong as part of tool installation and configuration. The best way to learn is to do, right?
That said, I can certainly bring to your attention my latest must-read recommendation for toolsmith aficionados: Richard Bejtlich’s The Practice of Network Security Monitoring. This gem from No Starch Press covers the life-cycle of network security monitoring (NSM) in great detail and leans on SO as its backbone. I recommend an immediate download of the latest version of SO and a swift purchase of Richard’s book.
Bro has been covered at length by Doug, Richard in his latest book, and others, so I won’t spend a lot of time on Bro configuration and usage. I’ll take you through a quick setup for our C3CM VM but the best kickoff point for your exploration of Bro, if you haven’t already been down the path to enlightenment, is Kevin Liston’s Internet Storm Center Diary post Why I Think You Should Try Bro. You’ll note as you read the post and comments that SO includes ELSA as an excellent “front end” for Bro and that you can be up and running with both when using SO. True (and ELSA does rock), but our mission here is to bring alternatives to light and heighten awareness for additional tools. As Logstash may be less extensively on infosec’s radar than Bro, I will spend a bit of time on its configuration and capabilities as a lens and amplifier for Bro logs. Logstash comes to you courtesy of Jordan Sissel. As I was writing this, Elasticsearch announced that Jordan will be joining them to develop Logstash with the Elasticsearch team. This is a match made in heaven and means nothing but good news for us from the end-user perspective. Add Kibana (also part of the Elasticsearch family) and we have Bro log analysis power of untold magnitude. To spell it all out for you, per the Elasticsearch site, you know have at your disposal, a “fully open source product stack for logging and events management: Logstash for log processing, Elasticsearch as the real time analytics and search engine, and Kibana as the visual front end.” Sweet!
 
Bro

First, a little Bro configuration work as this is the underpinning of our whole concept. I drew from Kevin Wilcox’s Open-Source Toolbox for a quick, clean Bro install. If you plan to cluster or undertake a production environment-worthy installation you’ll want to read the formal documentation and definitely do more research.
You’ll likely have a few of these dependencies already met but play it safe and run:
sudo apt-get install cmake make gcc g++ flex bison libpcap-dev libssl-dev python-dev swig zlib1g-dev libmagic-dev libgoogle-perftools-dev libgeoip-dev
Grab Bro: wget http://www.bro-ids.org/downloads/release/bro-2.1.tar.gz
Unpack it: tar zxf bro-2.1.tar.gz
CD to the bro-2.1 directory and run ./configure then make and finally sudo make install.
Run sudo visudo and add :/usr/local/bro/bin (inside the quotation marks) to the secure_path parameter to the end of the line the save the file and exit. This ensures that broctl, the Bro control program is available in the path.
Run sudo broctl and Welcome to BroControl 1.1 should pop up, then exit.
You’ll likely want to add broctl start to /etc/rc.local so Bro starts with the system, as well as add broctl cron to /etc/crontab.
There are Bro config files that warrant your attention as well in /usr/local/bro/etc. You’ll probably want have Bro listen via a promiscuous interface to a SPAN port or tapped traffic (NSA pickup line: “I’d tap that.” Not mine, but you can use it J). In node.cfg define the appropriate interface. This is also where you’d define standalone or clustered mode. Again keep in mind that in high traffic environments you’ll definitely want to cluster. Set your local networks in networks.cfg to help Bro understand ingress versus egress traffic. In broctl.cfg, tune the mail parameters if you’d like to use email alerts.
Run sudo broctl and then execute install, followed by start, then status to confirm you’re running. The most important part of this whole effort is where the logs end up given that that’s where we’ll tell Logstash to look shortly. Logs are stored in /usr/local/bro/logs by default, and are written to event directories named by date stamp. The most important directory however is /usr/local/bro/logs/current; this is where we’ll have Logstash keep watch. The following logs are written here, all with the .log suffix: communication, conn, dns, http, known_hosts, software, ssl, stderr, stdout, and weird.

Logstash

Logstash requires a JRE. You can ensure Java availability on our Ubuntu instance by installing OpenJDK via sudo apt-get install default-jre. If you prefer, install Oracle’s version then define your preference as to which version to use with sudo update-alternatives --config java. Once you’ve defined your selection java –version will confirm.
Logstash runs from a single JAR file; you can follow Jordan’s simple getting started guide and be running in minutes. Carefully read and play with each step in the guide, including saving to Elasticsearch, but use my logstash-c3cm.conf config file that I’ve posted to my site for you as part of the running configuration you’ll use. You’ll invoke it as follows (assumes the Logstash JAR and the conf file are in the same directory):
java -jar logstash-1.1.13-flatjar.jar agent -f logstash-c3cm.conf -- web --backend elasticsearch://localhost/
The result, when you browse to http://localhost:9292/search is a user interface that may remind you a bit of Splunk. There is a lot of query horsepower available here. If you’d like to search all entries in the weird.log as mentioned above, execute this query:
* @source_path:"//usr/local/bro/logs/current/weird.log"
Modify the log type to your preference (dns, ssl, etc) and you’re off to a great start. Weird.log includes “unusual or exceptional activity that can indicate malformed connections, traffic that doesn’t conform to a particular protocol, malfunctioning/misconfigured hardware, or even an attacker attempting to avoid/confuse a sensor” and notice.log will typically include “potentially interesting, odd, or bad” activity. Click any entry in the Logstash UI and you’ll see a pop-up window for “Fields for this log”. You can drill into each field for more granular queries and you can also drill in the graph to zoom into time periods as well. Figure 1 represents a query of weird.log in a specific time window.

FIGURE 1: Logstash query power
There is an opportunity to create a Bro plugin for Logstash, it’s definitely on my list.
Direct queries are excellent, but you’ll likely want to create dashboard views to your Bro data, and that’s where Kibana comes in.

Kibana

Here’s how easy this is. Download Kibana, unpack kibana-master.zip, rename the resulting directory to kibana, copy or move it to /var/www, edit config.js such that instead of localhost:9200 for the elasticsearch parameter, it’s set to the FQDN or IP address for the server, even if all elements are running on the same server as we are doing here. Point your browser to http://localhost/kibana/index.html#/dashboard/file/logstash.json and voila, you should see data. However, I’ve exported my dashboard file for you. Simply save it to /var/www/kibana/dashboards then click the open-folder icon in Dashboard Control and select C3CMBroLogstash.json. I’ve included one hour trending and search queries for each of the interesting Bro logs. You can tune these to your heart’s content. You’ll note the timepicker panel in the upper left-hand corner. Set auto-refresh on this and navigate over time as you begin to collect data as seen in Figure 2 where you’ll note a traffic spike specific to an Nmap scan.

FIGURE 2: Kibana dashboard with Nmap spike
Dashboards are excellent, and Kibana represents a ton of flexibility in this regard, but you’re probably asking yourself “How does this connect with the Interrupt phase of C3CM?” Bro does not serve as a true IPS per se, but actions can be established to clearly “interrupt control and communications capabilities of our digital assailants.” Note that one can use Bro scripts to raise notices and create custom notice actions per Notice Policy. Per a 2010 write-up on the Security Monks blog, consider Detection Followed By Action. “Bro policy scripts execute programs, which can, in turn, send e-mail messages, page the on-call staff, automatically terminate existing connections, or, with appropriate additional software, insert access control blocks into a router’s access control list. With Bro’s ability to execute programs at the operating system level, the actions that Bro can initiate are only limited by the computer and network capabilities that support Bro.” This is an opportunity for even more exploration and discovery; should you extend this toolset to create viable interrupts (I’m working on it but ran out of time for this month’s deadline), please let us know via comments or email.

In Conclusion

Recall from the beginning of this discussion that I've defined C3CM as methods by which to identify, interrupt, and counter the command, control, and communications capabilities of our digital assailants.
With Bro, Logstash, and Kibana, as part of our C3CM concept, the second phase (interrupt) becomes much more viable: better detection leads to better action. Next month we’ll discuss the counter phase of C3CM using ADHD (Active Defense Harbinger Distribution) scripts.
Ping me via email if you have questions (russ at holisticinfosec dot org).
Cheers…until next month.

Moving blog to HolisticInfoSec.io

toolsmith and HolisticInfoSec have moved. I've decided to consolidate all content on one platform, namely an R markdown blogdown sit...