Showing posts with label detection. Show all posts

Tuesday, April 03, 2018

toolsmith #132 - The HELK vs APTSimulator - Part 2


Continuing where we left off in The HELK vs APTSimulator - Part 1, I will focus our attention on additional, useful HELK features to aid you in your threat hunting practice. HELK offers Apache Spark, GraphFrames, and Jupyter Notebooks  as part of its lab offering. These capabilities scale well beyond a standard ELK stack, this really is where parallel computing and significantly improved processing and analytics truly take hold. This is a great way to introduce yourself to these technologies, all on a unified platform.

Let me break these down for you a little bit in case you haven't been exposed to these technologies yet. First and foremost, refer to @Cyb3rWard0g's wiki page on how he's designed it for his HELK implementation, as seen in Figure 1.
Figure 1: HELK Architecture
First, Apache Spark. For HELK, "Elasticsearch-hadoop provides native integration between Elasticsearch and Apache Spark, in the form of an RDD (Resilient Distributed Dataset) (or Pair RDD to be precise) that can read data from Elasticsearch." Per the Apache Spark FAQ, "Spark is a fast and general processing engine compatible with Hadoop data" to deliver "lighting-fast cluster computing."
Second, GraphFrames. From the GraphFrames overview, "GraphFrames is a package for Apache Spark which provides DataFrame-based Graphs. GraphFrames represent graphs: vertices (e.g., users) and edges (e.g., relationships between users). GraphFrames also provide powerful tools for running queries and standard graph algorithms. With GraphFrames, you can easily search for patterns within graphs, find important vertices, and more." 
Finally, Jupyter Notebooks to pull it all together.
From Jupyter.org: "The Jupyter Notebook is an open-source web application that allows you to create and share documents that contain live code, equations, visualizations and narrative text. Uses include: data cleaning and transformation, numerical simulation, statistical modeling, data visualization, machine learning, and much more." Jupyter Notebooks provide a higher order of analyst/analytics capabilities, if you haven't dipped your toe in that water, this may be your first, best opportunity.
Let's take a look at using Jupyter Notebooks with the data populated to my Docker-based HELK instance as implemented in Part 1. I repopulated my HELK instance with new data from a different, bare metal Windows instance reporting to HELK with Winlogbeat, Sysmon enabled, and looking mighty compromised thanks to @cyb3rops's APTSimulator.
To make use of Jupyter Notebooks, you need your JUPYTER CURRENT TOKEN to access the Jupyter Notebook web interface. It was presented to you when your HELK installation completed, but you can easily retrieve it via sudo docker logs helk-analytics, then copy and paste the URL into your browser to connect for the first time with a token. It will look like this,
http://localhost:8880/?token=3f46301da4cd20011391327647000e8006ee3574cab0b163, as described in the Installation wiki. After browsing to the URL with said token, you can begin at http://localhost:8880/lab, where you should immediately proceed to the Check_Spark_Graphframes_Integrations.ipynb notebook. It's found in the hierarchy menu under training > jupyter_notebooks > getting_started. This notebook is essential to confirming you're ingesting data properly with HELK and that its integrations are fully functioning. Step through it one cell at a time with the play button, allowing each task to complete so as to avoid errors. Remember the above mentioned Resilient Distributed Dataset? This notebook will create a Spark RDD on top of Elasticsearch using the logs-endpoint-winevent-sysmon-* (Sysmon logs) index as source, and do the same thing with the logs-endpoint-winevent-security-* (Window Security Event logs) index as source, as seen in Figure 2.
Figure 2: Windows Security EVT Spark RDD
The notebook will also query your Windows security events via Spark SQL, then print the schema with:
df = spark.read.format("org.elasticsearch.spark.sql").load("logs-endpoint-winevent-security-*/doc")
df.printSchema()
The result should resemble Figure 3.
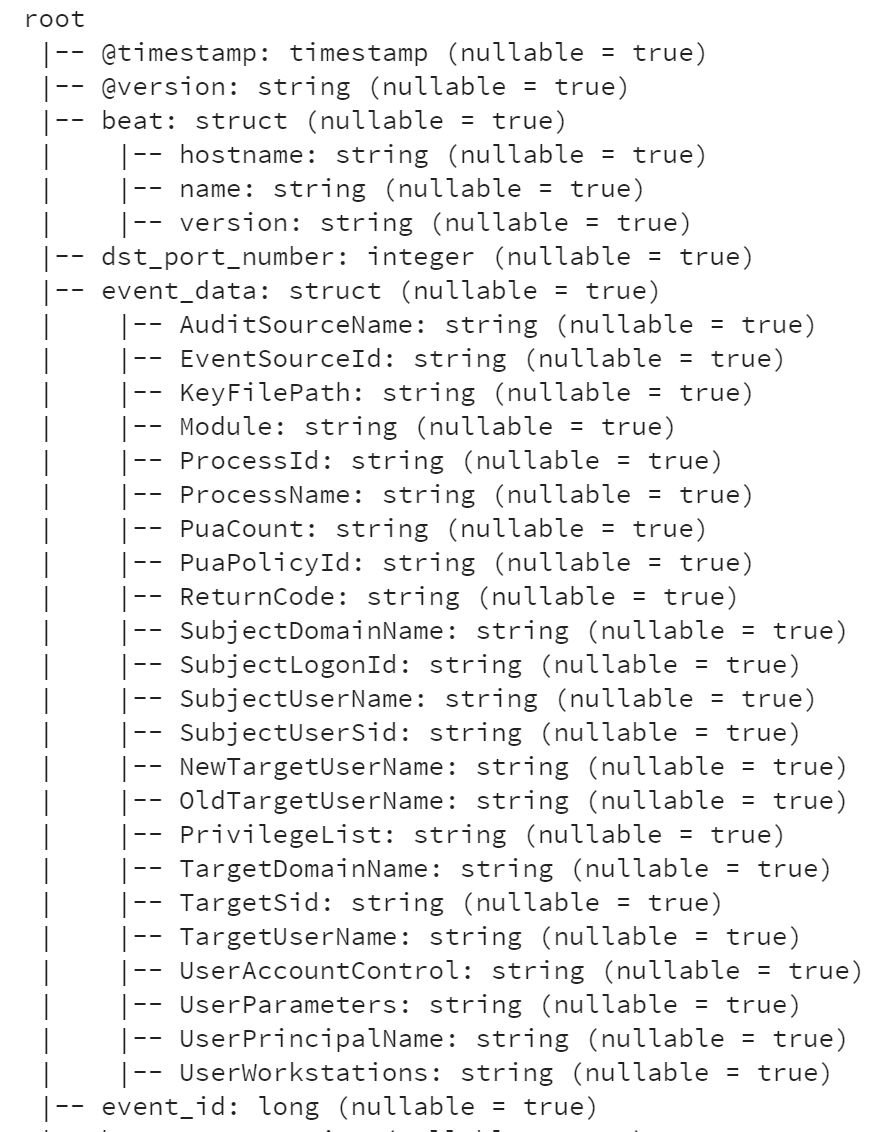
Figure 3: Schema
Assuming all matches with relative consistency in your experiment, let's move on to the Sysmon_ProcessCreate_Graph.ipynb notebook, found in training > jupyter_notebooks. This notebook will again call on the Elasticsearch Sysmon index and create vertices and edges dataframes, then create a graph produced with GraphFrame built from those same vertices and edges. Here's a little walk-through.
The v parameter (yes, for vertices) is populated with:
v = df.withColumn("id", df.process_guid).select("id","user_name","host_name","process_parent_name","process_name","action")
v = v.filter(v.action == "processcreate")
Showing the top three rows of that result set, with v.show(3,truncate=False), appears as Figure 4 in the notebook, with the data from my APTSimulator "victim" system, N2KND-PC.

Figure 4: WTF, Florian :-)
The epic, uber threat hunter in me believes that APTSimulator created nslookup, 7z, and regedit as processes via cmd.exe. Genius, right? :-)
The e parameter (yes, for edges) is populated with:
e = df.filter(df.action == "processcreate").selectExpr("process_parent_guid as src","process_guid as dst").withColumn("relationship", lit("spawned"))
Showing the top three rows of that result set, with e.show(3,truncate=False), produces the source and destination process IDs as it pertains to the spawning relationship.
Now, to create a graph from the vertices and edges dataframes as defined in the v & e parameters with g = GraphFrame(v, e). Let's bring it home with a hunt for Process A spawning Process B AND Process B Spawning Process C, the code needed, and the result, are seen from the notebook in Figure 5.
Figure 5: APTSimulator's happy spawn
Oh, yes, APTSimulator fully realized in a nice graph. Great example seen in cmd.exe spawning wscript.exe, which then spawns rundll32.exe. Or cmd.exe spawning powershell.exe and schtasks.exe.
Need confirmation? Florian's CactusTorch JS dropper is detailed in Figure 6, specifically cmd.exe > wscript.exe > rundll32.exe.
Figure 6: APTSimulator source for CactusTorch
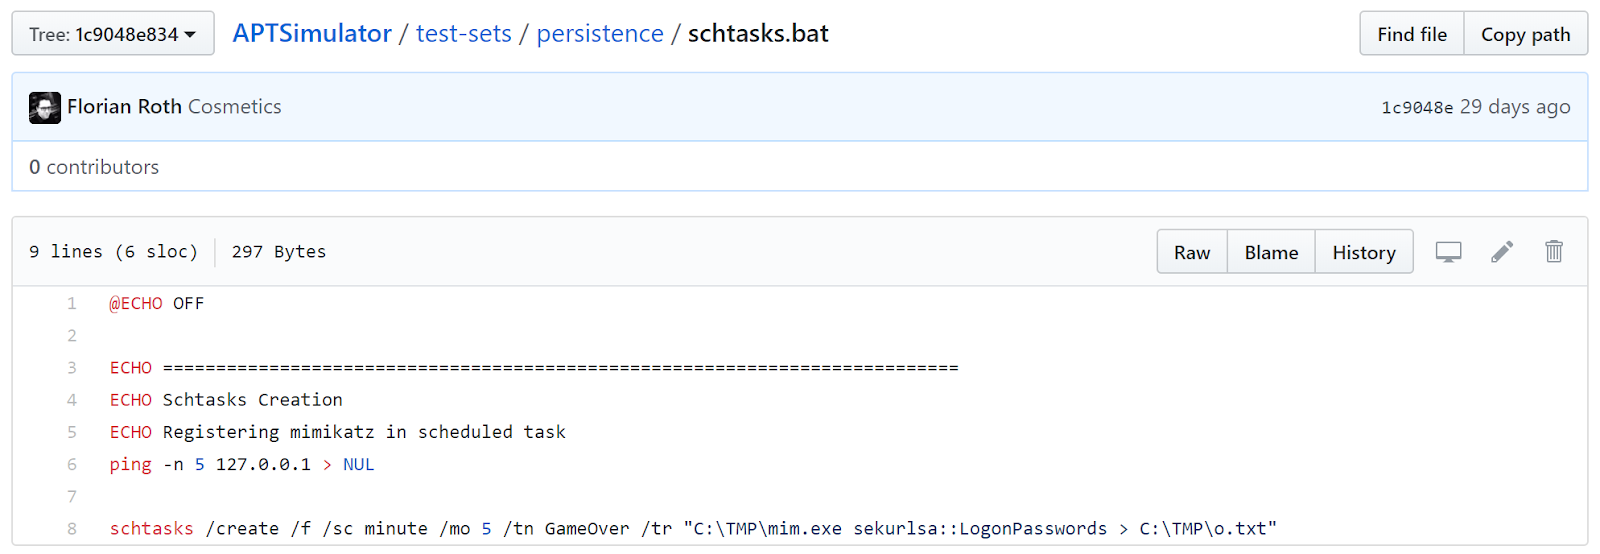
Still not convinced? How about APTSimulator's schtasks.bat, where APTSimulator kindly loads mimikatz with schtasks.exe for persistence, per Figure 7?
Figure 7: schtasks.bat
I certainly hope that the HELK's graph results matching nicely with APTSimulator source meets with your satisfaction.
The HELK vs APTSimulator ends with a glorious flourish, these two monsters in their field belong in every lab to practice red versus blue, attack and defend, compromise and detect. I haven't been this happy to be a practitioner in the defense against the dark arts in quite awhile. My sincere thanks to Roberto and Florian for their great work on the HELK and APTSimulator. I can't suggest strongly enough how much you'll benefit from taking the time to run through Part 1 and 2 of The HELK vs APTSimulator for yourself. Both tools are well documented on their respective Githubs, go now, get started, profit.
Cheers...until next time.

Sunday, February 11, 2018

toolsmith #131 - The HELK vs APTSimulator - Part 1

Ladies and gentlemen, for our main attraction, I give you...The HELK vs APTSimulator, in a Death Battle! The late, great Randy "Macho Man" Savage said many things in his day, in his own special way, but "Expect the unexpected in the kingdom of madness!" could be our toolsmith theme this month and next. Man, am I having a flashback to my college days, many moons ago. :-) The HELK just brought it on. Yes, I know, HELK is the Hunting ELK stack, got it, but it reminded me of the Hulk, and then, I thought of a Hulkamania showdown with APTSimulator, and Randy Savage's classic, raspy voice popped in my head with "Hulkamania is like a single grain of sand in the Sahara desert that is Macho Madness." And that, dear reader, is a glimpse into exactly three seconds or less in the mind of your scribe, a strange place to be certain. But alas, that's how we came up with this fabulous showcase.
In this corner, from Roberto Rodriguez, @Cyb3rWard0g, the specter in SpecterOps, it's...The...HELK! This, my friends, is the s**t, worth every ounce of hype we can muster.
And in the other corner, from Florian Roth, @cyb3rops, the The Fracas of Frankfurt, we have APTSimulator. All your worst adversary apparitions in one APT mic drop. This...is...Death Battle!

Now with that out of our system, let's begin. There's a lot of goodness here, so I'm definitely going to do this in two parts so as not undervalue these two offerings.
HELK is incredibly easy to install. Its also well documented, with lots of related reading material, let me propose that you take the tine to to review it all. Pay particular attention to the wiki, gain comfort with the architecture, then review installation steps.
On an Ubuntu 16.04 LTS system I ran:
  • git clone https://github.com/Cyb3rWard0g/HELK.git
  • cd HELK/
  • sudo ./helk_install.sh 
Of the three installation options I was presented with, pulling the latest HELK Docker Image from cyb3rward0g dockerhub, building the HELK image from a local Dockerfile, or installing the HELK from a local bash script, I chose the first and went with the latest Docker image. The installation script does a fantastic job of fulfilling dependencies for you, if you haven't installed Docker, the HELK install script does it for you. You can observe the entire install process in Figure 1.
Figure 1: HELK Installation
You can immediately confirm your clean installation by navigating to your HELK KIBANA URL, in my case http://192.168.248.29.
For my test Windows system I created a Windows 7 x86 virtual machine with Virtualbox. The key to success here is ensuring that you install Winlogbeat on the Windows systems from which you'd like to ship logs to HELK. More important, is ensuring that you run Winlogbeat with the right winlogbeat.yml file. You'll want to modify and copy this to your target systems. The critical modification is line 123, under Kafka output, where you need to add the IP address for your HELK server in three spots. My modification appeared as hosts: ["192.168.248.29:9092","192.168.248.29:9093","192.168.248.29:9094"]. As noted in the HELK architecture diagram, HELK consumes Winlogbeat event logs via Kafka.
On your Windows systems, with a properly modified winlogbeat.yml, you'll run:
  • ./winlogbeat -c winlogbeat.yml -e
  • ./winlogbeat setup -e
You'll definitely want to set up Sysmon on your target hosts as well. I prefer to do so with the @SwiftOnSecurity configuration file. If you're doing so with your initial setup, use sysmon.exe -accepteula -i sysmonconfig-export.xml. If you're modifying an existing configuration, use sysmon.exe -c sysmonconfig-export.xml.  This will ensure rich data returns from Sysmon, when using adversary emulation services from APTsimulator, as we will, or experiencing the real deal.
With all set up and working you should see results in your Kibana dashboard as seen in Figure 2.

Figure 2: Initial HELK Kibana Sysmon dashboard.
Now for the showdown. :-) Florian's APTSimulator does some comprehensive emulation to make your systems appear compromised under the following scenarios:
  • POCs: Endpoint detection agents / compromise assessment tools
  • Test your security monitoring's detection capabilities
  • Test your SOCs response on a threat that isn't EICAR or a port scan
  • Prepare an environment for digital forensics classes 
This is a truly admirable effort, one I advocate for most heartily as a blue team leader. With particular attention to testing your security monitoring's detection capabilities, if you don't do so regularly and comprehensively, you are, quite simply, incomplete in your practice. If you haven't tested and validated, don't consider it detection, it's just a rule with a prayer. APTSimulator can be observed conducting the likes of:
  1. Creating typical attacker working directory C:\TMP...
  2. Activating guest user account
    1. Adding the guest user to the local administrators group
  3. Placing a svchost.exe (which is actually srvany.exe) into C:\Users\Public
  4. Modifying the hosts file
    1. Adding update.microsoft.com mapping to private IP address
  5. Using curl to access well-known C2 addresses
    1. C2: msupdater.com
  6. Dropping a Powershell netcat alternative into the APT dir
  7. Executes nbtscan on the local network
  8. Dropping a modified PsExec into the APT dir
  9. Registering mimikatz in At job
  10. Registering a malicious RUN key
  11. Registering mimikatz in scheduled task
  12. Registering cmd.exe as debugger for sethc.exe
  13. Dropping web shell in new WWW directory
A couple of notes here.
Download and install APTSimulator from the Releases section of its GitHub pages.
APTSimulator includes curl.exe, 7z.exe, and 7z.dll in its helpers directory. Be sure that you drop the correct version of 7 Zip for your system architecture. I'm assuming the default bits are 64bit, I was testing on a 32bit VM.

Let's do a fast run-through with HELK's Kibana Discover option looking for the above mentioned APTSimulator activities. Starting with a search for TMP in the sysmon-* index yields immediate results and strikes #1, 6, 7, and 8 from our APTSimulator list above, see for yourself in Figure 3.

Figure 3: TMP, PS nc, nbtscan, and PsExec in one shot
Created TMP, dropped a PowerShell netcat, nbtscanned the local network, and dropped a modified PsExec, check, check, check, and check.
How about enabling the guest user account and adding it to the local administrator's group? Figure 4 confirms.

Figure 4: Guest enabled and escalated
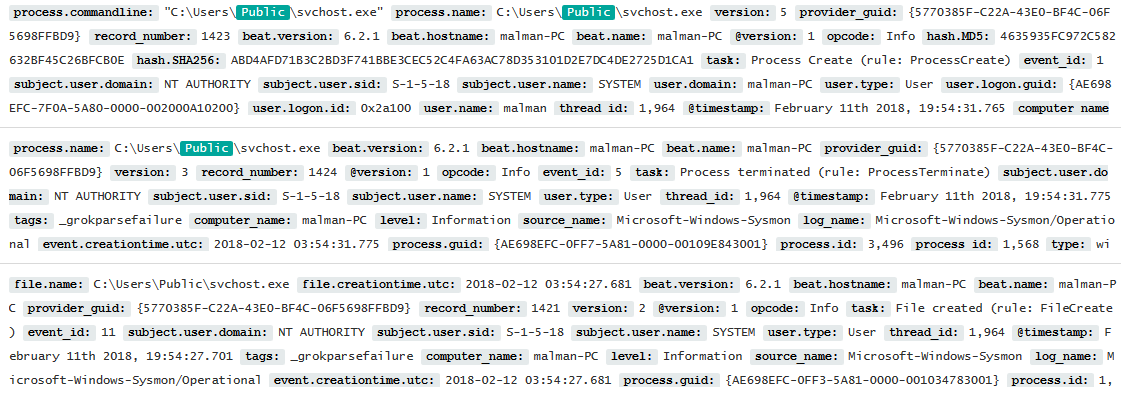
Strike #2 from the list. Something tells me we'll immediately find svchost.exe in C:\Users\Public. Aye, Figure 5 makes it so.

Figure 5: I've got your svchost right here
Knock #3 off the to-do, including the process.commandline, process.name, and file.creationtime references. Up next, the At job and scheduled task creation. Indeed, see Figure 6.

Figure 6. tasks OR schtasks
I think you get the point, there weren't any misses here. There are, of course, visualization options. Don't forget about Kibana's Timelion feature. Forensicators and incident responders live and die by timelines, use it to your advantage (Figure 7).

Figure 7: Timelion
Finally, for this month, under HELK's Kibana Visualize menu, you'll note 34 visualizations. By default, these are pretty basic, but you quickly add value with sub-buckets. As an example, I selected the Sysmon_UserName visualization. Initially, it yielded a donut graph inclusive of malman (my pwned user), SYSTEM and LOCAL SERVICE. Not good enough to be particularly useful I added a sub-bucket to include process names associated with each user. The resulting graph is more detailed and tells us that of the 242 events in the last four hours associated with the malman user, 32 of those were specific to cmd.exe processes, or 18.6% (Figure 8).

Figure 8: Powerful visualization capabilities
This has been such a pleasure this month, I am thrilled with both HELK and APTSimulator. The true principles of blue team and detection quality are innate in these projects. The fact that Roberto consider HELK still in alpha state leads me to believe there is so much more to come. Be sure to dig deeply into APTSimulator's Advance Solutions as well, there's more than one way to emulate an adversary.
Next month Part 2 will explore the Network side of the equation via the Network Dashboard and related visualizations, as well as HELK integration with Spark, Graphframes & Jupyter notebooks.
Aw snap, more goodness to come, I can't wait.
Cheers...until next time.

Saturday, December 31, 2016

The DFIR Hierarchy of Needs & Critical Security Controls

As you weigh how best to improve your organization's digital forensics and incident response (DFIR) capabilities heading into 2017, consider Matt Swann's Incident Response Hierarchy of Needs. Likely, at some point in your career (or therapy 😉) you've heard reference to Maslow's Hierarchy of Needs. In summary, Maslow's terms,  physiological, safety, belongingness & love, esteem, self-actualization, and self-transcendence, describe a pattern that human motivations generally move through, a pattern that is well represented in the form of a pyramid.
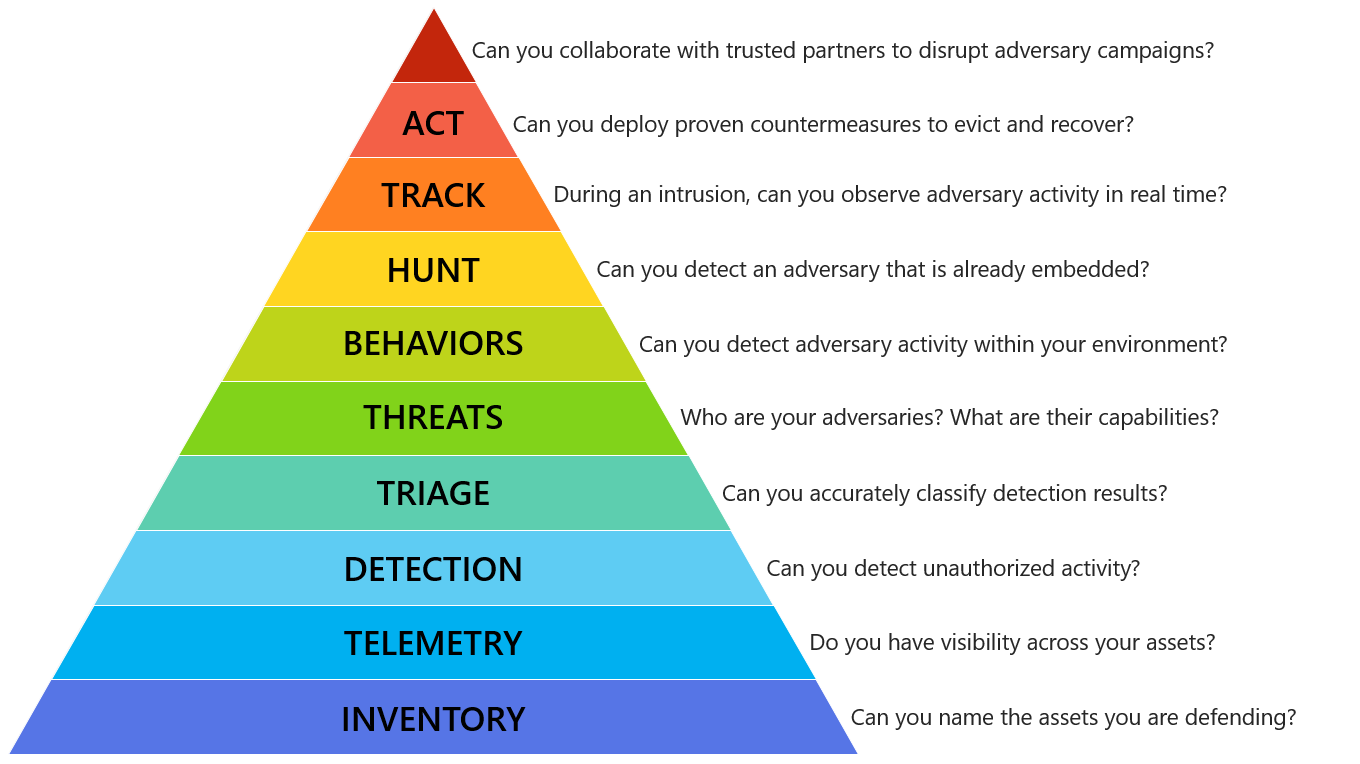
Matt has made great use of this model to describe an Incident Response Hierarchy of Needs, through which your DFIR methods should move. I argue that his powerful description of capabilities extends to the whole of DFIR rather than response alone. From Matt's Github, "the Incident Response Hierarchy describes the capabilities that organizations must build to defend their business assets. Bottom capabilities are prerequisites for successful execution of the capabilities above them:"

The Incident Response Hierarchy of Needs
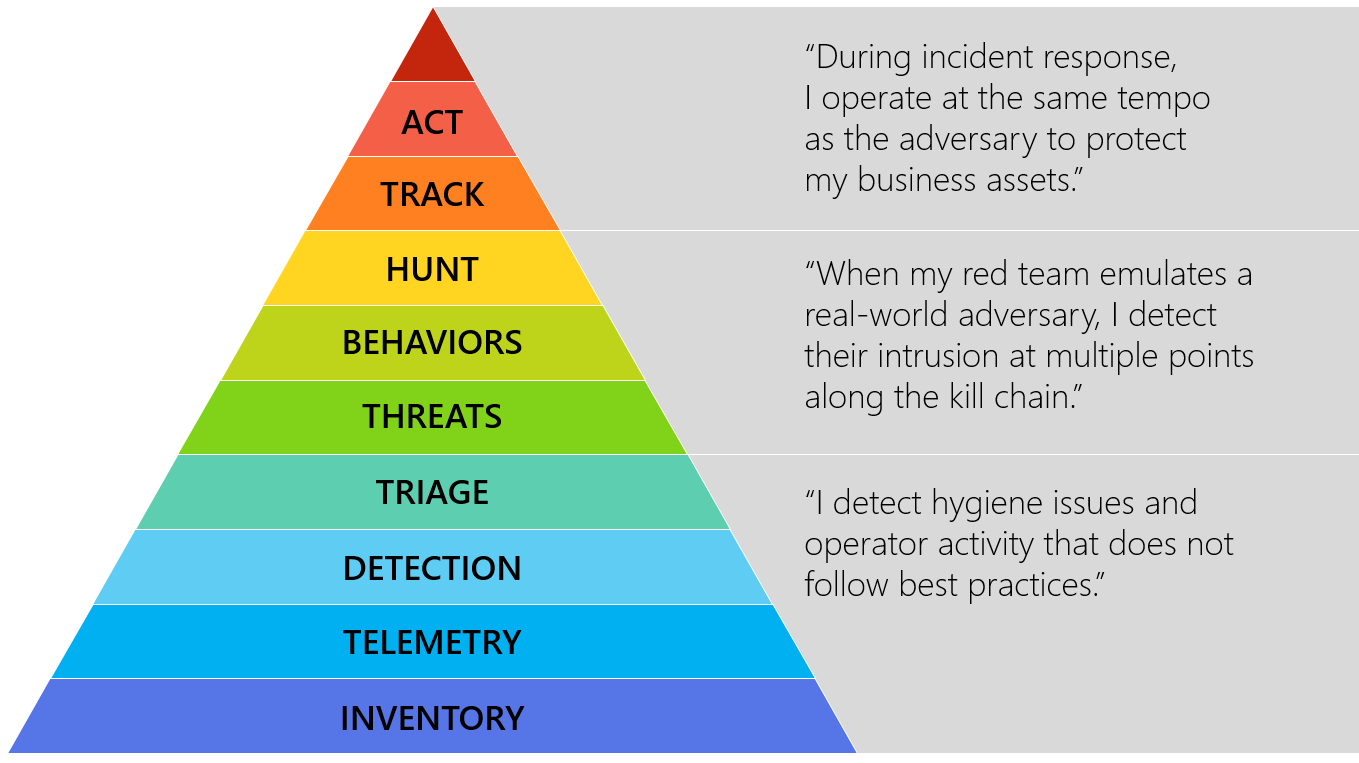
"The capabilities may also be organized into plateaus or phases that organizations may experience as they develop these capabilities:"

Hierarchy plateaus or phases
As visualizations, these representations really do speak for themselves, and I applaud Matt's fine work. I would like to propose that a body of references and controls may be of use to you in achieving this hierarchy to its utmost. I also welcome your feedback and contributions regarding how to achieve each of these needs and phases. Feel free to submit controls, tools, and tactics you have or would deploy to be successful in these endeavors; I'll post your submission along with your preferred social media handle.
Aspects of the Center for Internet Security Critical Security Controls Version 6.1 (CIS CSC) can be mapped to each of Matt's hierarchical entities and phases. Below I offer one control and one tool to support each entry. Note that there is a level of subjectivity to these mappings and tooling, but the intent is to help you adopt this thinking and achieve this agenda. Following is an example for each one, starting from the bottom of the pyramid.

 INVENTORY - Can you name the assets you are defending?  
Critical Security Control #1: Inventory of Authorized and Unauthorized Devices
Family: System
Control: 1.4     
"Maintain an asset inventory of all systems connected to the network and the network devices themselves, recording at least the network addresses, machine name(s), purpose of each system, an asset owner responsible for each device, and the department associated with each device. The inventory should include every system that has an Internet protocol (IP) address on the network, including but not limited to desktops, laptops, servers, network equipment (routers, switches, firewalls, etc.), printers, storage area networks, Voice Over-IP telephones, multi-homed addresses, virtual addresses, etc.  The asset inventory created must also include data on whether the device is a portable and/or personal device. Devices such as mobile phones, tablets, laptops, and other portable electronic devices that store or process data must be identified, regardless of whether they are attached to the organization’s network." 
Tool option:
Spiceworks Inventory

 TELEMETRY - Do you have visibility across your assets?  
Critical Security Control #6: Maintenance, Monitoring, and Analysis of Audit Logs
Family: System
Control: 6.6      "Deploy a SIEM (Security Information and Event Management) or log analytic tools for log aggregation and consolidation from multiple machines and for log correlation and analysis.  Using the SIEM tool, system administrators and security personnel should devise profiles of common events from given systems so that they can tune detection to focus on unusual activity, avoid false positives, more rapidly identify anomalies, and prevent overwhelming analysts with insignificant alerts."
Tool option:  
AlienVault OSSIM

 DETECTION - Can you detect unauthorized actvity? 
Critical Security Control #8: Malware Defenses
Family: System
Control: 8.1
"Employ automated tools to continuously monitor workstations, servers, and mobile devices with anti-virus, anti-spyware, personal firewalls, and host-based IPS functionality. All malware detection events should be sent to enterprise anti-malware administration tools and event log servers."
Tool option:
OSSEC Open Source HIDS SECurity

 TRIAGE - Can you accurately classify detection results? 
Critical Security Control #4: Continuous Vulnerability Assessment and Remediation
Family: System
Control: 4.3
"Correlate event logs with information from vulnerability scans to fulfill two goals. First, personnel should verify that the activity of the regular vulnerability scanning tools is itself logged. Second, personnel should be able to correlate attack detection events with prior vulnerability scanning results to determine whether the given exploit was used against a target known to be vulnerable."
Tool option:
OpenVAS         

 THREATS - Who are your adversaries? What are their capabilities? 
Critical Security Control #19: Incident Response and Management
Family: Application
Control: 19.7
"Conduct periodic incident scenario sessions for personnel associated with the incident handling team to ensure that they understand current threats and risks, as well as their responsibilities in supporting the incident handling team."
Tool option:
Security Incident Response Testing To Meet Audit Requirements

 BEHAVIORS - Can you detect adversary activity within your environment? 
Critical Security Control #5: Controlled Use of Administrative Privileges
Family: System
Control: 5.1
"Minimize administrative privileges and only use administrative accounts when they are required.  Implement focused auditing on the use of administrative privileged functions and monitor for anomalous behavior."
Tool option: 
Local Administrator Password Solution (LAPS)

 HUNT - Can you detect an adversary that is already embedded? 
Critical Security Control #6: Maintenance, Monitoring, and Analysis of Audit Logs       
Family: System
Control: 6.4
"Have security personnel and/or system administrators run biweekly reports that identify anomalies in logs. They should then actively review the anomalies, documenting their findings."
Tool option:
GRR Rapid Response

 TRACK - During an intrusion, can you observe adversary activity in real time? 
Critical Security Control #12: Boundary Defense
Family: Network
Control: 12.10
"To help identify covert channels exfiltrating data through a firewall, configure the built-in firewall session tracking mechanisms included in many commercial firewalls to identify TCP sessions that last an unusually long time for the given organization and firewall device, alerting personnel about the source and destination addresses associated with these long sessions."
Tool option:
Bro

 ACT - Can you deploy countermeasures to evict and recover? 
Critical Security Control #20: Penetration Tests and Red Team Exercises       
Family: Application
Control: 20.3
"Perform periodic Red Team exercises to test organizational readiness to identify and stop attacks or to respond quickly and effectively."
Tool option:
Red vs Blue - PowerSploit vs PowerForensics


 Can you collaborate with trusted parties to disrupt adversary campaigns? 
Critical Security Control #19: Incident Response and Management       
Family: Application
Control: 19.5
"Assemble and maintain information on third-party contact information to be used to report a security incident (e.g., maintain an e-mail address of security@organization.com or have a web page http://organization.com/security)."
Tool option:
MISP

I've mapped the hierarchy to the controls in CIS CSC 6.1 spreadsheet, again based on my experience and perspective, yours may differ, but consider similar activity.

CIS CSC with IR Hierarchy mappings


My full mapping of Matt's Incident Response Hierarchy of Needs in the
CIS CSC 6.1 spreadsheet is available here: http://bit.ly/CSC-IRH

I truly hope you familiarize yourself with Matt's Incident Response Hierarchy of Needs and find ways to implement, validate, and improve your capabilities accordingly. Consider that the controls and tools mentioned here are but a starting point and that you have many other options available to you. I look forward to hearing from you regarding your preferred tactics and tools as well. Kudos to Matt for framing this essential discussion so distinctly.

Moving blog to HolisticInfoSec.io

toolsmith and HolisticInfoSec have moved. I've decided to consolidate all content on one platform, namely an R markdown blogdown sit...