|
Continuing where we left off in The HELK vs APTSimulator - Part 1, I will focus our attention on additional, useful HELK features to aid you in your threat hunting practice. HELK offers Apache Spark, GraphFrames, and Jupyter Notebooks as part of its lab offering. These capabilities scale well beyond a standard ELK stack, this really is where parallel computing and significantly improved processing and analytics truly take hold. This is a great way to introduce yourself to these technologies, all on a unified platform.
Let me break these down for you a little bit in case you haven't been exposed to these technologies yet. First and foremost, refer to @Cyb3rWard0g's wiki page on how he's designed it for his HELK implementation, as seen in Figure 1.
First, Apache Spark. For HELK, "Elasticsearch-hadoop provides native integration between Elasticsearch and Apache Spark, in the form of an RDD (Resilient Distributed Dataset) (or Pair RDD to be precise) that can read data from Elasticsearch." Per the Apache Spark FAQ, "Spark is a fast and general processing engine compatible with Hadoop data" to deliver "lighting-fast cluster computing."
Second, GraphFrames. From the GraphFrames overview, "GraphFrames is a package for Apache Spark which provides DataFrame-based Graphs. GraphFrames represent graphs: vertices (e.g., users) and edges (e.g., relationships between users). GraphFrames also provide powerful tools for running queries and standard graph algorithms. With GraphFrames, you can easily search for patterns within graphs, find important vertices, and more."
Finally, Jupyter Notebooks to pull it all together.
From Jupyter.org: "The Jupyter Notebook is an open-source web application that allows you to create and share documents that contain live code, equations, visualizations and narrative text. Uses include: data cleaning and transformation, numerical simulation, statistical modeling, data visualization, machine learning, and much more." Jupyter Notebooks provide a higher order of analyst/analytics capabilities, if you haven't dipped your toe in that water, this may be your first, best opportunity.
Let's take a look at using Jupyter Notebooks with the data populated to my Docker-based HELK instance as implemented in Part 1. I repopulated my HELK instance with new data from a different, bare metal Windows instance reporting to HELK with Winlogbeat, Sysmon enabled, and looking mighty compromised thanks to @cyb3rops's APTSimulator.
To make use of Jupyter Notebooks, you need your JUPYTER CURRENT TOKEN to access the Jupyter Notebook web interface. It was presented to you when your HELK installation completed, but you can easily retrieve it via sudo docker logs helk-analytics, then copy and paste the URL into your browser to connect for the first time with a token. It will look like this,
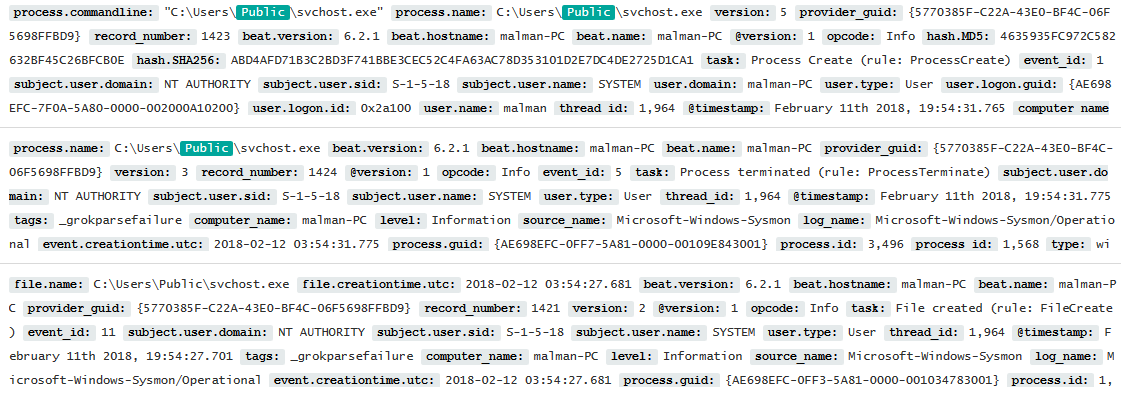
http://localhost:8880/?token=3f46301da4cd20011391327647000e8006ee3574cab0b163, as described in the Installation wiki. After browsing to the URL with said token, you can begin at http://localhost:8880/lab, where you should immediately proceed to the Check_Spark_Graphframes_Integrations.ipynb notebook. It's found in the hierarchy menu under training > jupyter_notebooks > getting_started. This notebook is essential to confirming you're ingesting data properly with HELK and that its integrations are fully functioning. Step through it one cell at a time with the play button, allowing each task to complete so as to avoid errors. Remember the above mentioned Resilient Distributed Dataset? This notebook will create a Spark RDD on top of Elasticsearch using the logs-endpoint-winevent-sysmon-* (Sysmon logs) index as source, and do the same thing with the logs-endpoint-winevent-security-* (Window Security Event logs) index as source, as seen in Figure 2.
The notebook will also query your Windows security events via Spark SQL, then print the schema with:
df = spark.read.format("org.elasticsearch.spark.sql").load("logs-endpoint-winevent-security-*/doc")
df.printSchema()
The result should resemble Figure 3.
Assuming all matches with relative consistency in your experiment, let's move on to the Sysmon_ProcessCreate_Graph.ipynb notebook, found in training > jupyter_notebooks. This notebook will again call on the Elasticsearch Sysmon index and create vertices and edges dataframes, then create a graph produced with GraphFrame built from those same vertices and edges. Here's a little walk-through.
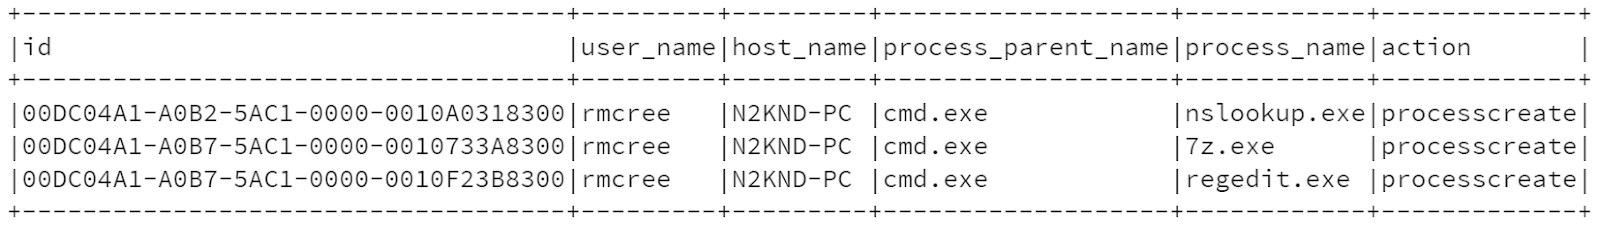
The v parameter (yes, for vertices) is populated with:
v = df.withColumn("id", df.process_guid).select("id","user_name","host_name","process_parent_name","process_name","action")
v = v.filter(v.action == "processcreate")
Showing the top three rows of that result set, with v.show(3,truncate=False), appears as Figure 4 in the notebook, with the data from my APTSimulator "victim" system, N2KND-PC.
The epic, uber threat hunter in me believes that APTSimulator created nslookup, 7z, and regedit as processes via cmd.exe. Genius, right? :-)
The e parameter (yes, for edges) is populated with:
e = df.filter(df.action == "processcreate").selectExpr("process_parent_guid as src","process_guid as dst").withColumn("relationship", lit("spawned"))
Showing the top three rows of that result set, with e.show(3,truncate=False), produces the source and destination process IDs as it pertains to the spawning relationship.
Now, to create a graph from the vertices and edges dataframes as defined in the v & e parameters with g = GraphFrame(v, e). Let's bring it home with a hunt for Process A spawning Process B AND Process B Spawning Process C, the code needed, and the result, are seen from the notebook in Figure 5.
Oh, yes, APTSimulator fully realized in a nice graph. Great example seen in cmd.exe spawning wscript.exe, which then spawns rundll32.exe. Or cmd.exe spawning powershell.exe and schtasks.exe.
Need confirmation? Florian's CactusTorch JS dropper is detailed in Figure 6, specifically cmd.exe > wscript.exe > rundll32.exe.
Still not convinced? How about APTSimulator's schtasks.bat, where APTSimulator kindly loads mimikatz with schtasks.exe for persistence, per Figure 7?
I certainly hope that the HELK's graph results matching nicely with APTSimulator source meets with your satisfaction.
The HELK vs APTSimulator ends with a glorious flourish, these two monsters in their field belong in every lab to practice red versus blue, attack and defend, compromise and detect. I haven't been this happy to be a practitioner in the defense against the dark arts in quite awhile. My sincere thanks to Roberto and Florian for their great work on the HELK and APTSimulator. I can't suggest strongly enough how much you'll benefit from taking the time to run through Part 1 and 2 of The HELK vs APTSimulator for yourself. Both tools are well documented on their respective Githubs, go now, get started, profit.
Cheers...until next time.
Let me break these down for you a little bit in case you haven't been exposed to these technologies yet. First and foremost, refer to @Cyb3rWard0g's wiki page on how he's designed it for his HELK implementation, as seen in Figure 1.
 |
| Figure 1: HELK Architecture |
Second, GraphFrames. From the GraphFrames overview, "GraphFrames is a package for Apache Spark which provides DataFrame-based Graphs. GraphFrames represent graphs: vertices (e.g., users) and edges (e.g., relationships between users). GraphFrames also provide powerful tools for running queries and standard graph algorithms. With GraphFrames, you can easily search for patterns within graphs, find important vertices, and more."
Finally, Jupyter Notebooks to pull it all together.
From Jupyter.org: "The Jupyter Notebook is an open-source web application that allows you to create and share documents that contain live code, equations, visualizations and narrative text. Uses include: data cleaning and transformation, numerical simulation, statistical modeling, data visualization, machine learning, and much more." Jupyter Notebooks provide a higher order of analyst/analytics capabilities, if you haven't dipped your toe in that water, this may be your first, best opportunity.
Let's take a look at using Jupyter Notebooks with the data populated to my Docker-based HELK instance as implemented in Part 1. I repopulated my HELK instance with new data from a different, bare metal Windows instance reporting to HELK with Winlogbeat, Sysmon enabled, and looking mighty compromised thanks to @cyb3rops's APTSimulator.
To make use of Jupyter Notebooks, you need your JUPYTER CURRENT TOKEN to access the Jupyter Notebook web interface. It was presented to you when your HELK installation completed, but you can easily retrieve it via sudo docker logs helk-analytics, then copy and paste the URL into your browser to connect for the first time with a token. It will look like this,
http://localhost:8880/?token=3f46301da4cd20011391327647000e8006ee3574cab0b163, as described in the Installation wiki. After browsing to the URL with said token, you can begin at http://localhost:8880/lab, where you should immediately proceed to the Check_Spark_Graphframes_Integrations.ipynb notebook. It's found in the hierarchy menu under training > jupyter_notebooks > getting_started. This notebook is essential to confirming you're ingesting data properly with HELK and that its integrations are fully functioning. Step through it one cell at a time with the play button, allowing each task to complete so as to avoid errors. Remember the above mentioned Resilient Distributed Dataset? This notebook will create a Spark RDD on top of Elasticsearch using the logs-endpoint-winevent-sysmon-* (Sysmon logs) index as source, and do the same thing with the logs-endpoint-winevent-security-* (Window Security Event logs) index as source, as seen in Figure 2.
 |
| Figure 2: Windows Security EVT Spark RDD |
df = spark.read.format("org.elasticsearch.spark.sql").load("logs-endpoint-winevent-security-*/doc")
df.printSchema()
The result should resemble Figure 3.
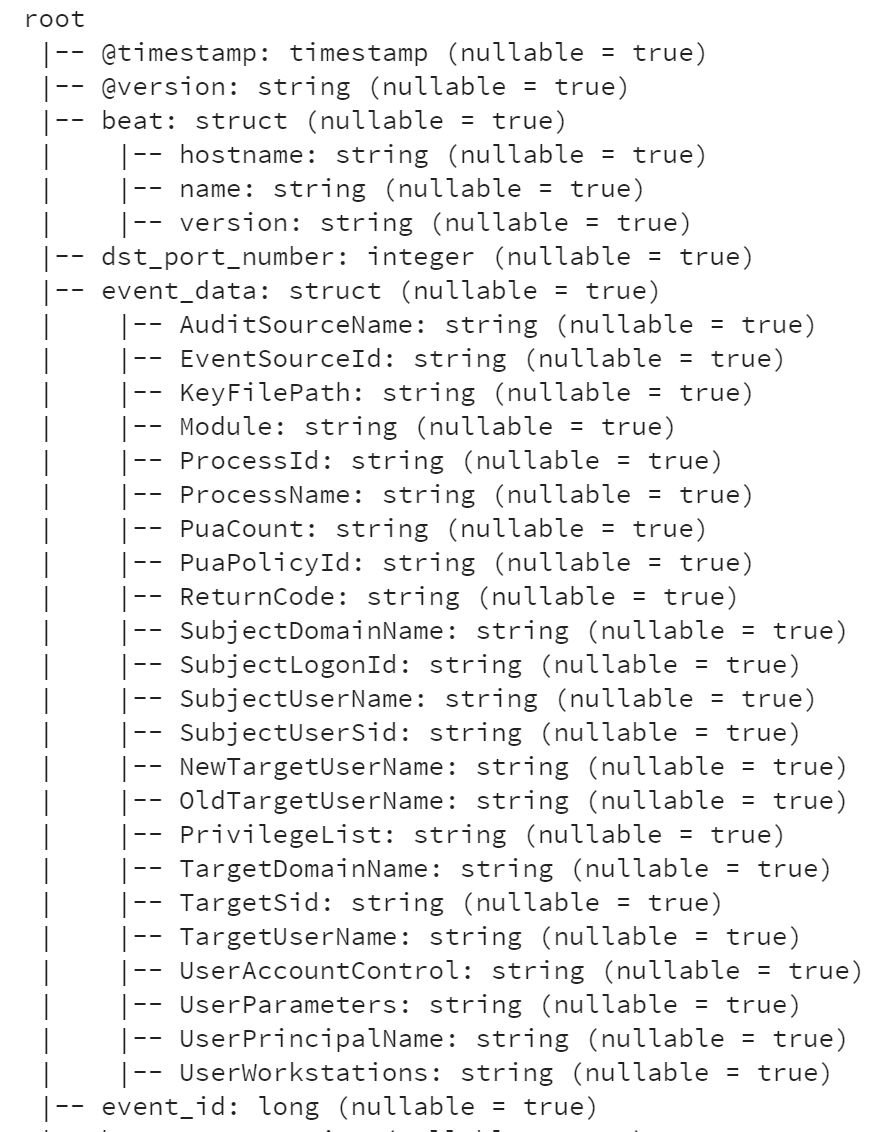 |
| Figure 3: Schema |
The v parameter (yes, for vertices) is populated with:
v = df.withColumn("id", df.process_guid).select("id","user_name","host_name","process_parent_name","process_name","action")
v = v.filter(v.action == "processcreate")
Showing the top three rows of that result set, with v.show(3,truncate=False), appears as Figure 4 in the notebook, with the data from my APTSimulator "victim" system, N2KND-PC.
 |
| Figure 4: WTF, Florian :-) |
The e parameter (yes, for edges) is populated with:
e = df.filter(df.action == "processcreate").selectExpr("process_parent_guid as src","process_guid as dst").withColumn("relationship", lit("spawned"))
Showing the top three rows of that result set, with e.show(3,truncate=False), produces the source and destination process IDs as it pertains to the spawning relationship.
Now, to create a graph from the vertices and edges dataframes as defined in the v & e parameters with g = GraphFrame(v, e). Let's bring it home with a hunt for Process A spawning Process B AND Process B Spawning Process C, the code needed, and the result, are seen from the notebook in Figure 5.
 |
| Figure 5: APTSimulator's happy spawn |
Need confirmation? Florian's CactusTorch JS dropper is detailed in Figure 6, specifically cmd.exe > wscript.exe > rundll32.exe.
 |
| Figure 6: APTSimulator source for CactusTorch |
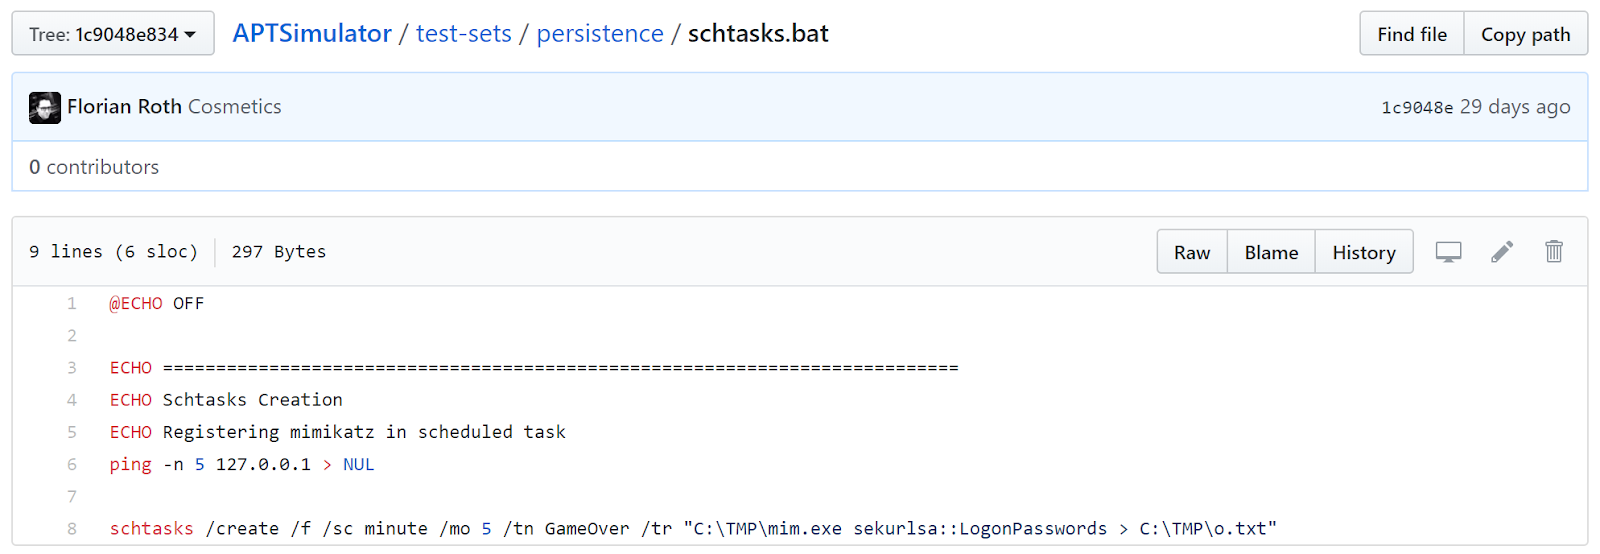 |
| Figure 7: schtasks.bat |
The HELK vs APTSimulator ends with a glorious flourish, these two monsters in their field belong in every lab to practice red versus blue, attack and defend, compromise and detect. I haven't been this happy to be a practitioner in the defense against the dark arts in quite awhile. My sincere thanks to Roberto and Florian for their great work on the HELK and APTSimulator. I can't suggest strongly enough how much you'll benefit from taking the time to run through Part 1 and 2 of The HELK vs APTSimulator for yourself. Both tools are well documented on their respective Githubs, go now, get started, profit.
Cheers...until next time.