Friday, November 01, 2013

toolsmith: OWASP Xenotix XSS Exploit Framework

Prerequisites
Current Windows operating system

Introduction
Hard to believe this month’s toolsmith marks seven full years of delivering dynamic content and covering timely topics on the perpetually changing threat-scape information security practitioners face every day. I’ve endeavored to aid in that process 94 straight months in a row, still enjoy writing toolsmith as much as I did day one, and look forward to many more to come. How better to roll into our eighth year than by zooming back to one of my favorite topics, cross-site scripting (XSS), with the OWASP Xenotix XSS Exploit Framework. I’d asked readers and Twitter followers to vote for November’s topic and Xenotix won by quite a majority. This was timely as I’ve also seen renewed interest in my Anatomy of an XSS Attack published in the ISSA Journal more than five years ago in June 2008. Hard to believe XSS vulnerabilities still prevail but according to WhiteHat Security’s May 2013 Statistics report:
1)      While no longer the most prevalent vulnerability, XSS is still #2 behind only Content Spoofing
2)      While 50% of XSS vulnerabilities were resolved, up from 48% in 2011, it still took an average of 227 for sites to deploy repairs
Per the 2013 OWASP Top 10, XSS is still #3 on the list. As such, good tools for assessing web applications for XSS vulnerabilities remain essential, and OWASP Xenotix XSS Exploit Framework fits the bill quite nicely.
Ajin Abraham (@ajinabraham) is Xenotix’s developer and project lead; his feedback on this project supports the ongoing need for XSS awareness and enhanced testing capabilities.
According to Ajin, most of the current pool of web application security tools still don't give XSS the full attention it deserves, an assertion he supports with their less than optimal detection rates and a high number of false positive. He has found that most of these tools use a payload database of about 70-150 payloads to scan for XSS. Most web application scanners, with the exception of few top notch proxies such as OWASP ZAP and Portswigger’s Burp Suite, don't provide much flexibility especially when dealing with headers and cookies. They typically have a predefined set of protocols or rules to follow and from a penetration tester’s perspective can be rather primitive. Overcoming some of these shortcomings is what led to the OWASP Xenotix XSS Exploit Framework.
Xenotix is a penetration testing tool developed exclusively to detect and exploit XSS vulnerabilities. Ajin claims that Xenotix is unique in that it is currently the only XSS vulnerability scanner with zero false positives. He attributes this to the fact that it uses live payload reflection-based XSS detection via its powerful triple browser rendering engines, including Trident, WebKit and Gecko. Xenotix apparently has the world's second largest XSS payload database, allowing effective XSS detection and WAF bypass. Xenotix is also more than a vulnerability scanner as it also includes offensive XSS exploitation and information gathering modules useful in generating proofs of concept.
For feature releases Ajin intends to implement additional elements such as an automated spider and an intelligent scanner that can choose payloads based on responses to increase efficiency and reduce overall scan time. He’s also working on an XSS payload inclusive of OSINT gathering which targets certain WAF's and web applications with specific payloads, as well as a better DOM scanner that works within the browser. Ajin welcomes support from the community. If you’re interested in the project and would like to contribute or develop, feel free to contact him via @ajinabraham, the OWASP Xenotix site, or the OpenSecurity site.

Xenotix Configuration

Xenotix installs really easily. Download the latest package (4.5 as this is written), unpack the RAR file, and execute Xenotix XSS Exploit Framework.exe. Keep in mind that antimalware/antivirus on Windows systems will detect xdrive.jar as a Trojan Downloader. Because that’s what it is. ;-) This is an enumeration and exploitation tool after all. Before you begin, watch Ajin’s YouTube video regarding Xenotix 4.5 usage. There is no written documentation for this tool so the video is very helpful. There are additional videos for older editions that you may find useful as well. After installation, before you do anything else, click Settings, then Configure Server, check the Semi Persistent Hook box, then click Start. This will allow you to conduct information gathering and exploitation against victims once you’ve hooked them.
Xenotix utilizes the Trident engine (Internet Explorer 7), the Webkit engine (Chrome 25), and the Gecko engine (Firefox 18), and includes three primary module sets: Scanner, Information Gathering, and XSS Exploitation as seen in Figure 1.

FIGURE 1: The Xenotix user interface
We’ll walk through examples of each below while taking advantage of intentional XSS vulnerabilities in the latest release of OWASPMutillidae II: Web Pwn in Mass Production. We covered Jeremy Druin’s (@webpwnized) Mutillidae in August 2012’s toolsmith and it’s only gotten better since.

Xenotix Usage

These steps assume you’ve installed Mutillidae II somewhere, ideally on a virtual machine, and are prepared to experiment as we walk through Xenotix here.
Let’s begin with the Scanner modules. Using Mutillidae’s DNS Lookup under OWASP Top 10 à A2 Cross Site Scripting (XSS) à Reflected (First Order) à DNS Lookup. The vulnerable GET parameter is page and on POST is target_host. Keep in mind that as Xenotix will confirm vulnerabilities across all three engines, you’ll be hard pressed to manage output, particularly if you run in Auto Mode; there is no real reporting function with this tool at this time. I therefore suggest testing in Manual Mode. This allows you to step through each payload and as seen Figure 2, we get our first hit with payload 7 (of 1530).

FIGURE 2: Xenotix manual XSS scanning
You can also try the XSS Fuzzer where you replace parameter values with a marker, [X], and fuzz in Auto Mode. The XSS Fuzzer allows you to skip ahead to a specific payload if you know the payload position index. Circling back to the above mentioned POST parameter, I used the POST Request Scanner to build a request, establishing http://192.168.40.139/mutillidae/index.php?page=dns-lookup.php as the URL and setting target_host in Parameters. Clicking POST then populated the form as noted in Figure 3 and as with Manual mode, our first hits came with payload 7.
FIGURE 3: Xenotix POST Request Scanner
You can also make use of Auto Mode, as well as DOM, Multiple Parameter, and Header Scanners, as well as a Hidden Parameter Detector.

The Information Gathering modules are where we can really start to have fun with Xenotix. You first have to hook a victim browser to make use of this tool set. I set the Xenotix server to the host IP where Xenotix was running (rather than the default localhost setting) and checked the Semi Persistent Hook checkbox. The resulting payload of
was then used with Mutillidae’s Pen Test Tool Lookup to hook a victim browser on a different system running Firefox on Windows 8.1. With the browser at my beck and call, I clicked Information Gathering where the Victim Fingerprinting module produced:
Again, entirely accurate. The Information Gathering modules also include WAF Fingerprinting, as well as Ping, Port, and Internal Network Scans. Remember that, as is inherent to its very nature, these scans occur in the context of the victimized browser’s system as a function of cross-site scripting.

Saving the most fun for last, let’s pwn this this thang! A quick click of XSS Exploitation offers us a plethora of module options. Remember, the victim browser is still hooked (xooked) via:
I sent my victim browser a message as depicted in Figure 4 where I snapped the Send Message configuration and the result in the hooked browser.

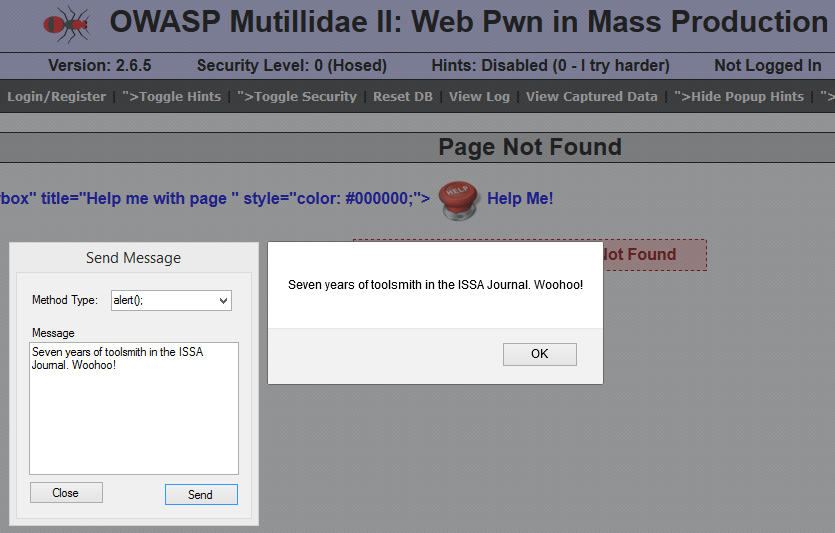
FIGURE 4: A celebratory XSS message
Message boxes are cute, Tabnabbing is pretty darned cool, but what does real exploitation look like? I first fired up the Phisher module with Renren (the Chinese Facebook) as my target site, resulting in a Page Fetched and Injected message and Renren ready for login in the victim browser as evident in Figure 5. Note that my Xenotix server IP address is the destination IP in the URL window.

FIGURE 5: XSS phishing Renren
But wait, there’s more. When the victim user logs in, assuming I’m also running the Keylogger module, yep, you guessed it. Figure 6 includes keys logged.

FIGURE 6: Ima Owned is keylogged
Your Renren is my Renren. What? Credential theft is not enough for you? You want to deliver an executable binary? Xenotix includes a safe, handy sample.exe to prove your point during demos for clients and/or decision makers. Still not convinced? Need shell? You can choose from JavaScript, Reverse HTTP, and System Shell Access. My favorite, as shared in Figure 7, is reverse shell via a Firefox bootstrapped add-on as delivered by XSS Exploitation --> System Shell Access --> Firefox Add-on Reverse Shell. Just Start Listener, then Inject (assumes a hooked browser).

FIGURE 7: Got shell?
Assuming the victim happily accepts the add-on installation request (nothing a little social engineering can’t solve), you’ll have system level access. This makes pentesters very happy. There are even persistence options via Firefox add-ons, more fun than a frog in a glass of milk.

In Conclusion

While this tool won’t replace proxy scanning platforms such as Burp or ZAP, it will enhance them most righteously. Xenotix is GREAT for enumeration, information gathering, and most of all, exploitation. Without question add the OWASP Xenotix XSS Exploit Framework to your arsenal and as always, have fun but be safe. Great work, Ajin, looking forward to more, and thanks to the voters who selected Xenotix for this month’s topic. If you have comments, follow me on Twitter via @holisticinfosec or email if you have questions via russ at holisticinfosec dot org.
Cheers…until next month.

Acknowledgements

Ajin Abraham, Information Security Enthusiast and Xenotix project lead

Thursday, October 03, 2013

C3CM: Part 3 – ADHD: Active Defense Harbinger Distribution

Prerequisites
Linux OS –Ubuntu Desktop 12.04 LTS discussed herein

Introduction
In Parts 1 & 2 of our C3CM discussion covered the identify and interrupt phases of the process I’ve defined as an effort to identify, interrupt, and counter the command, control, and communications capabilities of our digital assailants. In Part 3 I’m going to cover…hey, a squirrel! J In this, the final part of our series, I’ll arm you for the interrupt phase with ADHD…no, not that; rather, it’s the Active Defense Harbinger Distribution. You know how I know I have ADHD? My wife asked me for a glass of water and I made myself coffee instead. Wait, maybe that’s just selfish…er, nevermind.
I hope you’ve enjoyed utilizing Nfsight with Nfdump, Nfsen, and fprobe for our identification phase and BroIDS (Bro), Logstash, and Kibana as part of our interrupt phase. But I have to say, I think the fun really kicks in here when we consider how to counter our ne’er-do-well denizens of digital destruction. We’ll install the ADHD scripts on the C3CM Ubuntu system we’ve been building in Parts 1 and 2 but, much as you could have performed the interrupt phase using Doug Burk’s Security Onion (SO), you could download the full ADHD distribution and take advantage of it in its preconfigured splendor to conduct the counter phase. The truth of the matter is that running all the tools we’ve implemented during this C3CM campaign on one VM or physical machine, all at the same time, would be silly as you’d end up with port contention and resource limitations. Consider each of the three activities (identify, interrupt, and counter) as somewhat exclusive. Perhaps, clone three copies of the C3CM VM once we’re all finished and conduct each phase uniquely or simply do one at a time. The ADHD distribution (absolutely download it and experiment in addition to this activity) is definitely convenient and highly effective but again, I want you to continue developing your Linux foo, so carry on in our C3CM build out.
John Strand and Ethan Robish are the ADHD project leads, and Ethan kindly gave us direct insight into the project specific to the full distribution:
"ADHD is an ongoing project that features many tools to counter an attacker's ability to exploit and pivot within a network.  Tools such as Honey Badger, Pushpin, Web Bug Server, and Decloak provide a way of identifying an attacker's remote location, even if he has attempted to hide it.  Artillery, Nova, and Weblabyrinth, along with a few shell scripts provide honeypot-like functionality to confuse, disorient, and frustrate an attacker.  And then there are the well-known tools that help the good guys turn the tables on the attacker: the Social Engineering Toolkit (SET), the Browser Exploitation Framework (BeEF), and the Metasploit Framework (MSF).
Future plans for the project include the typical updates along with the addition of new tools.  Since the last release of ADHD, there has been some interesting research done by Chris John Riley on messing with web scanners.  His preliminary work was included with ADHD 0.5.0 but his new work will be better integrated and documented with the next release of ADHD.  We also plan to dive more into the detection of people that try to hide their identities behind proxies and other anonymizing measures.  Further down the line you may see some big changes to the underlying distribution itself.  We have started on a unified web control interface that will allow users of ADHD to control the various aspects of the system, as well as begun exploring how to streamline installation of both ADHD itself and the tools that are included.  Our goal is to make it as simple as possible to install and configure ADHD to run on your own network."
Again, we’re going to take, Artillery, Beartrap, Decloak, Honey Badger, Nova, Pushpin, Spidertrap, Web Bug Server, and Weblabyrinth and install them on our C3CM virtual machine as already in progress per Parts 1 and 2 of the series. In addition to all of Ethan’s hard work on Spidertrap, Web Bug Server, and Weblabyrinth, it’s with much joy that I’d like to point out that some of these devious offerings are devised by old friends of toolsmith. Artillery is brought to you by TrustedSec. TrustedSec is brought to you by Dave Kennedy (@dave_rel1k). Dave Kennedy brought us Social-Engineer Toolkit (SET) in February 2013 and March 2012 toolsmiths. Everyone loves Dave Kennedy.
Honey Badger and Pushpin are brought to you by @LaNMaSteR53. LaNMaSteR53 is Tim Tomes, who also works with Ethan and John at Black Hills Information Security. Tim Tomes brought us Recon-ng in May 2013’s toolsmith. Tim Tomes deserves a hooah. Hooah! The information security community is a small world, people. Honor your friends, value your relationships, watch each other’s backs, and praise the good work every chance you get.
Let’s counter, shall we? 

ADHD installation tips

Be sure to install git on your VM via sudo apt-get install git, execute mkdir ADHD, then cd ADHD, followed by one big bundle of git cloning joy (copy and paste this big boy as a whole):
git clone https://github.com/trustedsec/artillery/ artillery/&git clone https://github.com/chrisbdaemon/BearTrap/ BearTrap/&git clone https://bitbucket.org/ethanr/decloak decloak/&git clone https://bitbucket.org/LaNMaSteR53/honeybadger honeybadger/&git clone https://bitbucket.org/LaNMaSteR53/pushpin pushpin/&git clone https://bitbucket.org/ethanr/spidertrap spidertrap/&git clone https://bitbucket.org/ethanr/webbugserver webbugserver/&git clone https://bitbucket.org/ethanr/weblabyrinth weblabyrinth/
Nova is installed as a separate process as it’s a bigger app with a honeyd dependency. I’m hosting the installation steps on my website but to grab Nova and Honeyd issue the following commands from your ADHD directory:
git clone git://github.com/DataSoft/Honeyd.git   
git clone git://github.com/DataSoft/Nova.git Nova
cd Nova
git submodule init
git submodule update
The ADHD SourceForge Wiki includes individual pages for each script and details regarding their configuration and use. We’ll cover highlights here but be sure to read each in full for yourself.

ADHD

I’ve chosen a select couple of ADHD apps to dive in to starting with Nova.
Nova is an open-source anti-reconnaissance system designed to deny attackers access to real network data while providing false information regarding the number and types of systems connected to the network. Nova prevents and detects snooping by deploying realistic virtualized decoys while identifying attackers via suspicious communication and activity thus providing sysadmins with better situational awareness. Nova does this in part with haystacks, as in find the needle in the.
Assuming you followed the Nova installation guidance provided above, simply run quasar at a command prompt then browse to https://127.0.0.1:8080. Login with username nova and password toor. You’ll be prompted with the Quick Setup Wizard, do not use it.
From a command prompt execute novacli start haystack debug to ensure Haystack is running.
Click Haystacks under Configuration in the menu and define yourself a Haystack as seen in Figure 1.

FIGURE 1: Nova Haystack configuration
You can also add Profiles to emulate hosts that appear to attackers as very specific infrastructure such as a Cisco Catalyst 3500XL switch as seen in Figure 2.

FIGURE 2: Nova Profile configuration
Assuming Packet Classifier and Haystack status show as online, you can click Packet Classifier from the menu and begin to see traffic as noted in Figure 3.

FIGURE 3: Nova Packet Classifier (traffic overview)
What’s really cool here is that you can right-click on a suspect and train Nova to identify that particular host as malignant or benign per Figure 4.

FIGURE 4: Nova training capabilities
Over time training Nova will create a known good baseline for trusted hosts and big red flags for those that are evil. As you can see in Figure 5, you’ll begin to see Honeyd start killing attempted connections based on what it currently understands as block-worthy. Use the training feature to optimize and tune to your liking.

FIGURE 5: Honeyd killing attempted connections
Nova’s immediately interesting and beneficial; you’ll discern useful results very quickly.

The other ADHD app I find highly entertaining is Spider Trap. I come out on both sides of this argument. On one hand, until very recently I worked in the Microsoft organization that operates Bing. On the other hand, as website operator, I find crawler & spider traffic annoying and excessive (robots.txt is your friend assuming it’s honored). Bugs you too and you want to get a little payback? Expose Spider Trap where you know crawlers will land, either externally for big commercial crawlers, or internally where your pentesting friends may lurk. It’s just a wee Python script and you can run as simply as python2 spidertrap.py. I love Ethan’s idea to provide Spider Trap with a list of links. He uses the big list from OWASP DirBuster like this, python2 spidertrap.py DirBuster-Lists/directory-list-2.3-big.txt, but that could just as easily be any text list. Crawlers and spiders will loop ad infinitum achieving nothing. Want to blow an attacker or pentester’s mind? Use the list of usernames pulled from /etc/passwd I’ve uploaded for you as etcpasswd.txt.  Download etcpasswd.txt to the Spider Trap directory, then add the following after line 66 of spidertrap.py:
#Attacker/pentester misdirect
self.wfile.write("/etc/passwd")
Then run it like this: python2 spidertrap.py etcpasswd.txt.
The result will be something that will blow a scanner or manual reviewer’s mind. They’ll think they’ve struck pay dirt and have some weird awesome directory traversal bug at hand as seen in Figure 6.

FIGURE 6: Spider Trap causing confusion
Spider Trap runs by default on port 8000 but if you want to run it on 80 or something else just edit the script. Keep in mind if will fight with Apache if you try to use 80 and don’t service apache2 stop.
You can have a lot of fun at someone else’s expense with ADHD. Use it well, use it safely, but enjoy the prospect of countering your digital assailants in some manner.

In Conclusion

In closing, for this three part series I’ve defined C3CM as methods by which to identify, interrupt, and counter the command, control, and communications capabilities of our digital assailants.
With ADHD, the counter phase of our C3CM concept, is not only downright fun, but it becomes completely realistic to imagine taking active (legal) steps in defending your networks. ADHD gives me the energy to do anything and the focus to do nothing. Wait…never mind. Next month we’ll discuss…um, I can’t decide so you get to help!
For November, to celebrate seven years of toolsmith, which of the following three topics should toolsmith cover?
2)  Mantra vs. Minion 
Tweet your choice to me via @holisticinfosec and email if you have questions regarding C3CM via russ at holisticinfosec dot org.
Cheers…until next month.

Acknowledgements

John Strand and Ethan Robish, Black Hills Information Security

Wednesday, October 02, 2013

Joomla vulnerabilities & responsible disclosure: when being pwned is a positive

First, major kudos and thanks to Almas Malik, @AlmasMalik07, aka Code Smasher, who was kind enough to report to me the fact that my Joomla instance was vulnerable to CVE-2013-5576. His proof of concept was dropped to my /images directory as seen just below. :-)
Thank you, Almas, much appreciated and keep up the good work at http://www.hackingsec.in/.
That said, for all intents and purposes, I haz been pwned. :-(

Diving into the issue a bit:
Joomla versions prior to 2.5.14 and 3.1.5 are prone to a vulnerability that allows arbitrary file uploads. The issue occurs, of course, because the application fails to adequately sanitize user-supplied input. As it turns out in my case, an attacker may leverage this issue to upload arbitrary files to the affected system, possibly resulting in arbitrary code execution within the context of the vulnerable application.
The fact that holisticinfosec.org fell victim to this is frustrating as I had applied the 2.5.14 update almost immediately after it was released, and yet, quite obviously, it had not been successful applied. Be that a PEBKAC issue or something specific to the manner in which the patch was applied (I used the Joomla administrative portal update feature), I did not validate the results by testing the vulnerability before and after updating. The Metasploit module for this vuln works quite nicely, yet I didn't use it on myself. Doh!  As a result , as no fewer than three (two hostile, one responsible (Almas)) different entities did so for me after the vulnerability became well known and easily exploitable. As a result of my own lack of manual validation ex post facto, I know have the pleasure of Zone-H, Hack-DB, and VirusTotal entries.
On 20 and 21 AUG 2013, rain.txt was dropped courtesy of RainsevenDotMy and z.txt thanks to the Indonesian Cyber Army. Why the sudden interest from Malaysian and Indonesian hacktivists, other than my leaving such low hanging fruit out there for the taking, I cannot say.


The only bonus for me was the fact that my allowed file and MIME-type upload settings prevented anything but image or text files to be uploaded. As a result, no PHP backdoor shells; I'm thankful for that upside.
The reality is that you should upload files via FTP/SFTP and disable use of the Joomla uploader if at all possible. Definitely check your permissions settings and lock them down as much as you possibly can. Clearly I suck at administering Joomla or we wouldn't be having this conversation. While tools such as Joomla are wonderful for ease of use and convenience, as always, your personal Interwebs are only as strong as your weakest link. Patch fast, patch often: Joomla does an excellent job of timely and transparent security updates.

Following is an example log entry specific to the attack:
202.152.201.176 - - [20/Aug/2013:23:46:44 -0600] "POST /index.php?option=com_media&task=file.upload&tmpl=component&13be59a364339033944efaed9643ff7b=m4okdrsoa26agbebn1g0kmsh72&9f6534d02839c15e08087ddebdc0f835=1&asset=com_content&author=&view=images&folder= HTTP/1.1" 303 901 "http://holisticinfosec.org/index.php?option=com_media&view=images&tmpl=component&fieldid=&e_name=jform_articletext&asset=com_content&author=&folder=" "Mozilla/5.0 (Windows NT 6.1) AppleWebKit/537.36 (KHTML, like Gecko) Chrome/28.0.1500.95 Safari/537.36"

Recommendations for Joomla users:
1) Update to 2.5.14 and 3.1.5, and confirm that the update was applied correctly.
2) Review your logs from 1 AUG 2013 to date. Use file.upload as a keyword in POST requests.
3) Check your images directory for the presence of TXT or PHP files that clearly shouldn't be there.
4) Take advantage of security services such as antimalware and change monitoring.
5) Monitor search engines for entries specific to your domains at sites such as Zone-H, Hack-DB, and VirusTotal.
6) To the tune of the William Tell Overture: read your logs, read your logs, read your logs, logs, logs.

While I'm bummed that I'm reminding myself of the very lessons I've reminded others of for years, I'm glad to share findings in the context of responsible disclosure and to reiterate the lessons learned.
Thanks again to @AlmasMalik07 for the heads up and PoC.


Monday, September 02, 2013

C3CM: Part 2 – Bro with Logstash and Kibana

Prerequisites
Linux OS –Ubuntu Desktop 12.04 LTS discussed herein

Introduction
In Part 1 of our C3CM discussion we established that, when applied to the practice of combating bots and APTs, C3CM can be utilized to identify, interrupt, and counter the command, control, and communications capabilities of our digital assailants. 
Where, in part one of this three part series, we utilized Nfsight with Nfdump, Nfsen, and fprobe to conduct our identification phase, we’ll use Bro, Logstash, and Kibana as part of our interrupt phase. Keep in mind that while we’re building our own Ubuntu system to conduct our C3CM activities you can perform much of this work from Doug Burks' outstanding Security Onion (SO). You’ll have to add some packages such as those we did for Part 1, but Bro as described this month is all ready to go on SO. Candidly, I’d be using SO for this entire series if I hadn't already covered it in toolsmith, but I’m also a firm believer in keeping the readership’s Linux foo strong as part of tool installation and configuration. The best way to learn is to do, right?
That said, I can certainly bring to your attention my latest must-read recommendation for toolsmith aficionados: Richard Bejtlich’s The Practice of Network Security Monitoring. This gem from No Starch Press covers the life-cycle of network security monitoring (NSM) in great detail and leans on SO as its backbone. I recommend an immediate download of the latest version of SO and a swift purchase of Richard’s book.
Bro has been covered at length by Doug, Richard in his latest book, and others, so I won’t spend a lot of time on Bro configuration and usage. I’ll take you through a quick setup for our C3CM VM but the best kickoff point for your exploration of Bro, if you haven’t already been down the path to enlightenment, is Kevin Liston’s Internet Storm Center Diary post Why I Think You Should Try Bro. You’ll note as you read the post and comments that SO includes ELSA as an excellent “front end” for Bro and that you can be up and running with both when using SO. True (and ELSA does rock), but our mission here is to bring alternatives to light and heighten awareness for additional tools. As Logstash may be less extensively on infosec’s radar than Bro, I will spend a bit of time on its configuration and capabilities as a lens and amplifier for Bro logs. Logstash comes to you courtesy of Jordan Sissel. As I was writing this, Elasticsearch announced that Jordan will be joining them to develop Logstash with the Elasticsearch team. This is a match made in heaven and means nothing but good news for us from the end-user perspective. Add Kibana (also part of the Elasticsearch family) and we have Bro log analysis power of untold magnitude. To spell it all out for you, per the Elasticsearch site, you know have at your disposal, a “fully open source product stack for logging and events management: Logstash for log processing, Elasticsearch as the real time analytics and search engine, and Kibana as the visual front end.” Sweet!
 
Bro

First, a little Bro configuration work as this is the underpinning of our whole concept. I drew from Kevin Wilcox’s Open-Source Toolbox for a quick, clean Bro install. If you plan to cluster or undertake a production environment-worthy installation you’ll want to read the formal documentation and definitely do more research.
You’ll likely have a few of these dependencies already met but play it safe and run:
sudo apt-get install cmake make gcc g++ flex bison libpcap-dev libssl-dev python-dev swig zlib1g-dev libmagic-dev libgoogle-perftools-dev libgeoip-dev
Grab Bro: wget http://www.bro-ids.org/downloads/release/bro-2.1.tar.gz
Unpack it: tar zxf bro-2.1.tar.gz
CD to the bro-2.1 directory and run ./configure then make and finally sudo make install.
Run sudo visudo and add :/usr/local/bro/bin (inside the quotation marks) to the secure_path parameter to the end of the line the save the file and exit. This ensures that broctl, the Bro control program is available in the path.
Run sudo broctl and Welcome to BroControl 1.1 should pop up, then exit.
You’ll likely want to add broctl start to /etc/rc.local so Bro starts with the system, as well as add broctl cron to /etc/crontab.
There are Bro config files that warrant your attention as well in /usr/local/bro/etc. You’ll probably want have Bro listen via a promiscuous interface to a SPAN port or tapped traffic (NSA pickup line: “I’d tap that.” Not mine, but you can use it J). In node.cfg define the appropriate interface. This is also where you’d define standalone or clustered mode. Again keep in mind that in high traffic environments you’ll definitely want to cluster. Set your local networks in networks.cfg to help Bro understand ingress versus egress traffic. In broctl.cfg, tune the mail parameters if you’d like to use email alerts.
Run sudo broctl and then execute install, followed by start, then status to confirm you’re running. The most important part of this whole effort is where the logs end up given that that’s where we’ll tell Logstash to look shortly. Logs are stored in /usr/local/bro/logs by default, and are written to event directories named by date stamp. The most important directory however is /usr/local/bro/logs/current; this is where we’ll have Logstash keep watch. The following logs are written here, all with the .log suffix: communication, conn, dns, http, known_hosts, software, ssl, stderr, stdout, and weird.

Logstash

Logstash requires a JRE. You can ensure Java availability on our Ubuntu instance by installing OpenJDK via sudo apt-get install default-jre. If you prefer, install Oracle’s version then define your preference as to which version to use with sudo update-alternatives --config java. Once you’ve defined your selection java –version will confirm.
Logstash runs from a single JAR file; you can follow Jordan’s simple getting started guide and be running in minutes. Carefully read and play with each step in the guide, including saving to Elasticsearch, but use my logstash-c3cm.conf config file that I’ve posted to my site for you as part of the running configuration you’ll use. You’ll invoke it as follows (assumes the Logstash JAR and the conf file are in the same directory):
java -jar logstash-1.1.13-flatjar.jar agent -f logstash-c3cm.conf -- web --backend elasticsearch://localhost/
The result, when you browse to http://localhost:9292/search is a user interface that may remind you a bit of Splunk. There is a lot of query horsepower available here. If you’d like to search all entries in the weird.log as mentioned above, execute this query:
* @source_path:"//usr/local/bro/logs/current/weird.log"
Modify the log type to your preference (dns, ssl, etc) and you’re off to a great start. Weird.log includes “unusual or exceptional activity that can indicate malformed connections, traffic that doesn’t conform to a particular protocol, malfunctioning/misconfigured hardware, or even an attacker attempting to avoid/confuse a sensor” and notice.log will typically include “potentially interesting, odd, or bad” activity. Click any entry in the Logstash UI and you’ll see a pop-up window for “Fields for this log”. You can drill into each field for more granular queries and you can also drill in the graph to zoom into time periods as well. Figure 1 represents a query of weird.log in a specific time window.

FIGURE 1: Logstash query power
There is an opportunity to create a Bro plugin for Logstash, it’s definitely on my list.
Direct queries are excellent, but you’ll likely want to create dashboard views to your Bro data, and that’s where Kibana comes in.

Kibana

Here’s how easy this is. Download Kibana, unpack kibana-master.zip, rename the resulting directory to kibana, copy or move it to /var/www, edit config.js such that instead of localhost:9200 for the elasticsearch parameter, it’s set to the FQDN or IP address for the server, even if all elements are running on the same server as we are doing here. Point your browser to http://localhost/kibana/index.html#/dashboard/file/logstash.json and voila, you should see data. However, I’ve exported my dashboard file for you. Simply save it to /var/www/kibana/dashboards then click the open-folder icon in Dashboard Control and select C3CMBroLogstash.json. I’ve included one hour trending and search queries for each of the interesting Bro logs. You can tune these to your heart’s content. You’ll note the timepicker panel in the upper left-hand corner. Set auto-refresh on this and navigate over time as you begin to collect data as seen in Figure 2 where you’ll note a traffic spike specific to an Nmap scan.

FIGURE 2: Kibana dashboard with Nmap spike
Dashboards are excellent, and Kibana represents a ton of flexibility in this regard, but you’re probably asking yourself “How does this connect with the Interrupt phase of C3CM?” Bro does not serve as a true IPS per se, but actions can be established to clearly “interrupt control and communications capabilities of our digital assailants.” Note that one can use Bro scripts to raise notices and create custom notice actions per Notice Policy. Per a 2010 write-up on the Security Monks blog, consider Detection Followed By Action. “Bro policy scripts execute programs, which can, in turn, send e-mail messages, page the on-call staff, automatically terminate existing connections, or, with appropriate additional software, insert access control blocks into a router’s access control list. With Bro’s ability to execute programs at the operating system level, the actions that Bro can initiate are only limited by the computer and network capabilities that support Bro.” This is an opportunity for even more exploration and discovery; should you extend this toolset to create viable interrupts (I’m working on it but ran out of time for this month’s deadline), please let us know via comments or email.

In Conclusion

Recall from the beginning of this discussion that I've defined C3CM as methods by which to identify, interrupt, and counter the command, control, and communications capabilities of our digital assailants.
With Bro, Logstash, and Kibana, as part of our C3CM concept, the second phase (interrupt) becomes much more viable: better detection leads to better action. Next month we’ll discuss the counter phase of C3CM using ADHD (Active Defense Harbinger Distribution) scripts.
Ping me via email if you have questions (russ at holisticinfosec dot org).
Cheers…until next month.

Saturday, August 03, 2013

toolsmith: C3CM Part 1 – Nfsight with Nfdump and Nfsen


Prerequisites
Linux OS –Ubuntu Desktop 12.04 LTS  discussed herein

Introduction
I’ve been spending a fair bit of time reading, studying, writing, and presenting as part of Officer Candidate training in the Washington State Guard. When I’m pinned I may be one of the oldest 2nd Lieutenants you’ve ever imagined (most of my contemporaries are Lieutenant Colonels and Colonels) but I will have learned beyond measure. As much of our last drill weekend was spent immersed in Army operations I’ve become quite familiar with Army Field Manuals 5-0 The Operations Process and 1-02 Operational Terms and Graphics. Chapter 2 of FM 1-02, Section 1 includes acronyms and abbreviations and it was there I spotted it, the acronym for command, control, and communications countermeasures: C3CM. This gem is just ripe for use in the cyber security realm and I intend to be the first to do so at length.  C2 analysis may be good enough for most but I say let’s go next level. ;-) Initially, C3CM was most often intended to wreck the command and control of enemy air defense networks, a very specific Air Force mission. Apply that mindset in the context of combating bots and APTs and you’re onboard. Our version of C3CM therefore is to identify, interrupt, and counter the command, control, and communications capabilities of our digital assailants. 
Part one of our three part series on C3CM will utilize Nfsight with Nfdump, Nfsen, and fprobe to conduct our identification phase. These NetFlow tools make much sense when attempting to identify the behavior of your opponent on high volume networks that don’t favor full packet capture or inspection.
A few definitions and descriptions to clarify our intent:
1)      NetFlow is Cisco’s protocol for collecting IP traffic information and is an industry standard for traffic monitoring
2)      Fprobe is a libpcap-based tool that collects network traffic data and emits it as NetFlow flows towards the specified collector and is very useful for collecting NetFlow from Linux interfaces
3)      Nfdump tools collect and process NetFlow data on the command line and are part of the Nfsen project
4)      Nfsen is the graphical web based front end for the Nfdump NetFlow tools
5)      Nfsight, our primary focus, as detailed on its Sourceforge page, is a NetFlow processing and visualization application designed to offer a comprehensive network awareness. Developed as a Nfsen plugin to construct bidirectional flows out of the unidirectional NetFlow flows, Nfsight leverages these bidirectional flows to provide client/server identification and intrusion detection capabilities.
Nfdump and Nfsen are developed by Peter Haag while Nfsight is developed by Robin Berthier. Robin provided extensive details regarding his project. He indicated that Nfsight was born from the need to easily retrieve a list of all the active servers in a given network. Network operators and security administrators are always looking for this information in order to maintain up-to-date documentation of their assets and to rapidly detect rogue hosts. As mentioned above, it made sense to extract this information from NetFlow data for practicality and scalability. Robin pointed out that NetFlow is already deployed in most networks and offers a passive and automated way to explore active hosts even in extremely large networks (such as the spectacularly massive Microsoft datacenter environment I work in). The primary challenge in designing and implementing Nfsight lay in accurately identifying clients and servers from omnidirectional NetFlow records given that NetFlow doesn't keep track of client/server sessions; a given interaction between two hosts will lead to two separate NetFlow records. Nfsight is designed to pair the right records and to identify which host initiated the connection and does so through a set of heuristics that are combined with a Bayesian inference algorithm. Robin pointed out that timing (which host started the connection) and port numbers (which host has a higher port number) are two examples of heuristics used to differentiate client from server in bidirectional flows. He also stated that the advantage of Bayesian inference is to converge towards a more accurate identification as evidence is collected over time from the different heuristics. As a result, Nfsight gains a comprehensive understanding of active servers in a network after only few hours.
Another important Nfsight feature is the visual interface that allows operators to query and immediately display the results through any Web browser. One can, as an example, query for all the SSH servers.
“The tool will show a matrix where each row is a server (IP address and port/service) and each column is a timeslot. The granularity of the timeslot can be configured to represent a few minutes, an hour, or a day. Each cell in the matrix shows the activity of the server for the specific time period. Operators instantly assess the nature and volume of client/server activity through the color and the brightness of the colored cell. Those cells can even show the ratio of successful to unsuccessful network sessions through the red color. This enables operators to identify scanning behavior or misconfiguration right away. This feature was particularly useful during an attack against SSH servers recorded in a large academic network. As shown on the screenshot below, the green cells represent normal SSH server activity and suddenly, red/blue SSH client activity starts, indicating a coordinated scan.”

FIGURE 1: Nfsight encapsulates attack against SSH servers
Robin described the investigation of the operating systems on those SSH servers where the sysadmins found that they were using a shared password database that an attacker was able to compromise. The attacker then installed a bot in each of the server, and launched a scanning campaign from each compromised server. Without the visual representation provided by Nfsight, it would have taken much longer to achieve situational awareness, or worse, the attack could have gone undetected for days.
I am here to tell you, dear reader, with absolute experiential certainty, that this methodology works at scale for identifying malicious or problematic traffic, particularly when compared against threat feeds such as those provided by Collective Intelligence Framework. Think about it from the perspective of detecting evil for cloud services operators and how to do so effectively at scale. Tools such as Nfdump, Nfsen, and Nfsight start to really make sense.

Preparing your system for Nfsight

Now that you’re all excited, I will spend a good bit of time on installation as I drew from a number of sources to achieve an effective working base for part one of our three part series of C3CM. This is laborious and detailed so pay close attention. I started working from an Ubuntu Desktop 12.04 LTS virtual machine I keep in my collection, already configure with Apache and MySQL. One important distinction here. I opted to not spin up my old Cisco Catalyst 3500XL in my lab as it does not support NetFlow and instead opted to use fprobe to generate flows right on my Ubuntu instance being configured as an Nfsen/Nfsight collector. This is acceptable in a low volume lab like mine but won’t be effective in any production environment. You’ll be sending flows from supported devices to your Nfsen/Nfsight collector(s) and defining them explicitly in your Nfsen configuration as we’ll discuss shortly. Keep in mind that preconfigured distributions such as Network Security Toolkit come with the like of Nfdump and Nfsen already available but I wanted to start from scratch with a clean OS so we can build our own C3CM host during this three part series.
From your pristine Ubuntu instance, begin with a system update to ensure all packages are current: sudo apt-get update && sudo apt-get upgrade.
You can configure the LAMP server during VM creation from the ISO or do so after the fact with sudo apt-get install tasksel then sudo tasksel and select LAMP server.
Install the dependencies necessary for Nfsen and Nfsight:  
sudo apt-get install rrdtool mrtg librrds-perl librrdp-perl librrd-dev nfdump libmailtools-perl php5 bison flex librrds-perl libpcap-dev libdbi-perl picviz fprobe
You’ll be asked two question during this stage of the install.  The fprobe install will ask which interface to capture from; typically the default is eth0. For Collector address, respond with localhost:9001. You can opt for a different port but we’ll use 9001 later when configuring the listening component of Nfsen. During the mrtg install, when prompted to answer “Make /etc/mrtg.cfg owned by and readable only by root?" answer Yes.
The Network Startup Resource Center (NSRC) conducts annual workshops; in 2012 during their Network Monitoring and Managements event Nfsen installation was discussed at length. Following their guidance:

Install and configure Nfsen:
cd /usr/local/src
sudo wget "http://sourceforge.net/projects/nfsen/files/latest/download " -O nfsen.tar.gz
sudo tar xvzf nfsen.tar.gz
cd nfsen-1.3.6p1
cd etc
sudo cp nfsen-dist.conf nfsen.conf
sudo gedit nfsen.conf
Set the $BASEDIR variable: $BASEDIR="/var/nfsen";
Adjust the tools path to where items actually reside:
# Nfdump tools path
$PREFIX = '/usr/bin';
Define users for Apache access:
$WWWUSER = 'www-data';
$WWWGROUP = 'www-data';
Set small buffer size for quick data rendering:
# Receive buffer size for nfcapd
$BUFFLEN = 2000;
Find the %sources definition, and modify as follows (same port number as set in fprobe install):
%sources=(
'eth0' => {'port'=>'9001','col'=>'#0000ff','type'=>'netflow'},
);
Save and exit gedit.

Create the NetFlow user on the system:
sudo useradd -d /var/netflow -G www-data -m -s /bin/false netflow

Initialize Nfsen:
cd /usr/local/src/nfsen-1.3.6p1
sudo ./install.pl etc/nfsen.conf
sudo /var/nfsen/bin/nfsen start
You may notice errors that include pack_sockaddr_in6 and unpack_sockaddr_in6; these can be ignored.
Run sudo /var/nfsen/bin/nfsen status to ensure that Nfsen is running properly.

Install the Nfsen init script:
sudo ln -s /var/nfsen/bin/nfsen /etc/init.d/nfsen
sudo update-rc.d nfsen defaults 20

You’re halfway there now. Check your Nfsen installation via your browser.
Note: if you see a backend version mismatch message, incorporate the changes into nfsen.php as noted in this diff file. As data starts coming in (you can force this with a ping –t (Windows) of your Nfsen collector IP and/or an extensive Nmap scan) you should see results similar to those seen from the Details tab in Figure 2 (allow it time to populate).

FIGURE 2: Nfsen beginning to render data

Install Nfsight, as modified from Steronius’ Computing Bits (follow me explicitly here):
cd /usr/local/src
sudo wget "http://sourceforge.net/projects/nfsight/files/latest/download" -O nfsight.tar.gz
sudo tar xvzf nfsight.tar.gz
cd nfsight-beta-20130323
sudo cp backend/nfsight.pm /var/nfsen/plugins/
sudo mkdir /var/www/nfsen/plugins/nfsight
sudo chgrp -R www-data /var/www/nfsen/plugins/nfsight
sudo mkdir /var/www/nfsen/nfsight
sudo cp -R frontend/* /var/www/nfsen/nfsight/
sudo chgrp -R www-data /var/www/nfsen/nfsight/
sudo chmod g+w /var/www/nfsen/nfsight/
sudo chmod g+w /var/www/nfsen/plugins/nfsight/
sudo chmod g+w /var/www/nfsen/nfsight/cache
sudo chmod g+x /var/www/nfsen/nfsight/bin/biflow2picviz.pl

Create Nfsight database:
Interchange the root user with an Nfsight database user if you’re worried about running the Nfsight db with root.
mysql -u root –p and enter your MySql root password
mysql> CREATE DATABASE nfsight
mysql> GRANT ALL PRIVILEGES ON nfsight.* TO root@'%' IDENTIFIED BY '';
mysql> grant all privileges on nfsight.* TO root@localhost IDENTIFIED BY '';
mysql> GRANT ALL PRIVILEGES ON nfsight.* TO 'root'@'%' WITH GRANT OPTION;
mysql> FLUSH PRIVILEGES;
mysql> quit
Launch the Nfsight web installer; on my server the path is:
http://192.168.42.131/nfsen/nfsight/installer.php
The proper paths for our installation are:
URL = /nfsen/nfsight/
Path to data files = /var/www/nfsen/plugins/nfsight
You may need to edit detail.php to ensure proper paths for grep, cat, and pcv. They should read as follows:
/bin/grep
/bin/cat
/usr/bin/pcv
Edit /var/nfsen/etc/nfsen.conf with settings from the Nfsight installer.php output as seen in Figure 3.

FIGURE 3: Configure nfsen.conf for Nfsight
Restart Nfsen:
/var/nfsen/bin/nfsen stop
/var/nfsen/bin/nfsen start
Check status: /var/nfsen/bin/nfsen status

Last step! Install the hourly cronjob required by Nfsight to periodically update the database:
crontab -e
06 * * * *  /usr/bin/wget --no-check-certificate -q -O - http://management:aggregate@127.0.0.1/nfsen/nfsight/aggregate.php
Congratulations, you should now be able to login to Nfsight! The credentials to login to Nfsight are those you defined when running the Nfsight installer script (installer.php). On my server, I do so at http://192.168.42.131/nfsen/nfsight/index.php.

Nfsight in flight

After all that, you’re probably ready to flame me with a “WTF did you just make me do, Russ!” email. I have to live up to being the tool in toolsmith, right? I’m with you, but it will have been worth it, I promise. As flows begin to populate data you’ll have the ability to drill into specific servers, clients, and services. I generated some noisy traffic against some Microsoft IP ranges that I was already interested in validating which in turn gave the impression of a host on my network scanning for DNS servers. Figure 4 show an initial view where my rogue DNS scanner shows up under Top 20 active internal servers.

FIGURE 4: Nfsight’s Top 20
You can imagine how, on a busy network, these Top 20 views could be immediately helpful in identifying evil egress traffic. If you click on a particular IP in a Top 20 view you’ll be treated to service activity in a given period (adjustable in three hour increments). You can then drill in further by 5 minute increments as seen in Figure 5 where you’ll note all the IPs my internal hosts was scanning on port 53. You can also render a parallel plot (courtesy of PicViz installed earlier). Every IPv4 octet, port number, and service are hyperlinks to more flow data, so just keep on clicking. When you click a service port number and it offers you information about a given port, thanks to the SANS Internet Storm Center as you are directed to the ISC Port Report for that particular service when you click the resulting graph.
See? I told you it would be worth it.

FIGURE 5: Nfsight Activity Overview
All functionality references are available on the Wiki, must importantly recognize that the color codes are red for unanswered scanner activity, blue for client activity, and green for server activity.
You can select save this view and create what will then be available as an event in the Nfsight database. I saved one from what you see in Figure 5 and called it Evil DNS Egress. These can then be reloaded by clicking Events from the upper right-hand corner of the Nfsight UI.
Nfsight also includes a flow-based intrusion detection system called Nfids, still considered a work in progress. Nfids will generate alerts that are stored in a database and aggregated over time, and alerts that are recorded more than a given number of time are reported to the frontend. These alerts are generated based on five heuristic categories including: malformed, one-to-many IP, one-to-many port, many-to-one IP, and many-to-one port.
You can also manage your Nfsight settings from this region of the application, including Status, Accounts, Preferences, Configuration, and Logs. You can always get back to the home page by simply clicking Nfsight in the upper-left corner of the UI.
As the feedback on the Nfsight SourceForge site says, “small and efficient and gets the job done.”

In Conclusion

Recall from the beginning of this discussion that I’ve defined C3CM as methods by which to identify, interrupt, and counter the command, control, and communications capabilities of our digital assailants
Nfsight, as part of our C3CM concept, represents the first step (and does a heck of a good job doing it) of my C3CM process: identify. Next month we’ll discuss the interrupt phase of C3CM using BroIDS and Logstash.
Ping me via email if you have questions (russ at holisticinfosec dot org).
Cheers…until next month.

Acknowledgements

Robin Berthier, Nfsight developer


Moving blog to HolisticInfoSec.io

toolsmith and HolisticInfoSec have moved. I've decided to consolidate all content on one platform, namely an R markdown blogdown sit...