Thursday, March 01, 2012

toolsmith: Pen Testing with Pwn Plug


Prerequisites
4GB SD card (needed for installation)


Dedicated to the memory of Tareq Saade 1983-2012:
This flesh and bone 
Is just the way that we are tied in 
But there's no one home
I grieve for you –Peter Gabriel 

Introduction
As you likely know by now given toolsmith’s position at the back of the ISSA Journal, March’s theme is Advanced Threat Concepts and Cyberwarfare. Well, dear reader, for your pwntastic reading pleasure I have just the topic for you. The Pwn Plug can be considered an advanced threat and useful in tactics that certainly resemble cyberwarfare methodology. Of course, those of us in the penetration testing discipline would only ever use such a device to the benefit of our legally engaged targets.
A half year ago I read about the Pwn Plug when it was offered in partnership with SANS for students taking vLive versions of SEC560: Network Penetration Testing and Ethical Hacking or SEC660: Advanced Penetration Testing, Exploits, and Ethical Hacking. It seemed very intriguing, but I’d already taken the 560 track, and was immersed in other course work. Then a couple of months ago I read that Pwnie Express had released the Pwn Plug Community Edition and was even more intrigued but I had a few things I planned to purchase for the lab before adding a Sheevaplug to the collection.  
But alas, the small world clause kicked in, and Dave Porcello (grep) and Mark Hughes from Pwnie Express, along with Peter LaPlante emailed to ask if I’d like to review a Pwn Plug.
The answer to that which you, dear readers, know to be a rhetorical question goes without saying.
Here’s the caveat. For toolsmith I’ll only discuss offering that are free and/or open source. Pwn Plug Community Edition meets that standard, but the Pwnie Express team provided me with a Pwn Plug Elite for testing. As such, for this article, I will discuss only the features freely available in the CE to anyone who owns a Sheevaplug: “Pwn Plug Community Edition does not include the web-based Plug UI, 3G/GSM support, NAC/802.1x bypass.”
For those of you interested in a review of the remaining features exclusive to commercial versions, I’ll post it to my blog on the heels of this column’s publishing.
Dave provided me with a few insights including the Pwn Plug's most common use cases:
·         Remote, low-cost pen testing: penetration test customers save on travel expenses, service providers save on travel time
·         Penetration tests with a focus on physical security and social engineering
·         Data leakage/exfiltration testing: using a variety of covert channels, the Pwn Plug is able to tunnel through many IDS/IPS solutions and application-aware firewalls undetected
·         Information security training: the Pwn Plug touches on many facets of information security (physical, social & employee awareness, data leakage, etc.), thus making it a comprehensive (and fun!) learning tool

One of Pwnie Express’ favorite success stories comes from Jayson Street (The Forbidden Network) who was hired by a large bank to conduct a physical/social penetration test on ten bank branch offices. Armed with a Pwn Plug and a bit of social engineering finesse, Jayson was able to deploy a Pwn Plug to four out of four branch offices attempted against before the client decided to cut their losses and end the test early. In one instance, a branch manager actually directed Jayson to connect the Pwn Plug underneath his desk. Pwnie Express hopes the Pwn Plug helps illustrate how critical physical security and employee awareness are and Jayson’s efforts delivered exactly that to his enterprise client.
Adrian Crenshaw (Irongeek) has Jayson’s Derbycon 2011 presentation video posted on his site. It’s well worth your time to watch it.

In addition to the Pwn Plug there is also the Pwn Phone which is also capable of full-scale wireless penetration testing. Penetration testers and service providers often utilize the Pwn Phone for proposal meetings and demonstrations as the "wow factor" is high. As with Pwn Plug, if you already own or can acquire a Nokia N900 you can download the community edition of Pwn Phone and get after it right away.

PwnPlug compatibility is currently limited to Sheevaplug devices. There has been little demand so far for the Guruplug/Dreamplug form factors and the Guruplug hardware has a history of overheating while the Dreamplug is quite bulky and flashy. Bulky and flashy do not equate to good resources for physical & social testing. The development team is working on a trimmed down of Pwn Plug for the $25 Pogoplug. Even though it only offers about half the performance and capacity of the Sheeva, with a larger board, it is only $25.

Figure 1 is a picture taken of the Pwn Plug I was sent for testing. You can see what we mean by the importance of form factor. It’s barely bigger that a common wall wart and you can use the included cord or plug it in straight to the wall. Pwnie Express included a couple of sticker options for the Sheeva. I chose what looks to be a very typical bar code and manufacturer sticker that even has a PX part number. I chuckle every time I look at it.

Figure 1: Who, me?
With Sheevaplugs typically sporting a 1.2Ghz ARM processor, 512M SDRAM, and 512M NAND Flash configuration it’s recommended that you don’t treat the device like a work horse (no Fastttack, Autopwn, or password cracking) but it’s crazy good for maintaining access in stealth mode, reconnaissance, sniffing, exploitation, and pivoting off to other victim hosts. Figure you’ll find the 512M storage at about 70% of capacity after installation but adding SD storage means you can add software within reason. Pwn Plug is Ubuntu underneath so apt-get is still your friend.
The tool list for a device this small is impressive. Expect to find MSF3, dsniff, fasttrack, kismet, nikto, ptunnel, scapy and many others at you command, most of which can be called right from the prompt without changing directories.

Installation

To install Pwn Plug CE to a stock Sheevaplug download the JFFS2 and follow the instructions. No need to reinvent the wheel here.

Pwning with PwnPlug

To ensure full understanding for those who may not think in evil mode or conduct penetration testing activity, here’s a quick executive summary followed by the longer play:
Sneak a Pwn Plug into a physical location, plug it in, and properly configured it phones home allowing you reverse shell access via a number of possible stealth modes. You can then set up a variety of exploit activities and/or run scanners or do specific social engineering activity I am about to demonstrate. The results are collected on the device and you can then collect them over the established shell access.

First, imagine the Pwn Plug hidden at the target site, lurking amongst all the other items usually plugged in to a power strip, hiding behind a desk in so innocuous a fashion so as to go easily undetected. Figure 2 will send you scurrying about your workplace to ensure there are none in hiding as we speak.

Figure 2: The Pwn Plug looking so innocent 
I’ll walk through an extremely fun example with Pwn Plug but first you’ll need to ensure access. Commercial Pwn Plug users benefit from the Plug UI but those rolling their own with Pwn Plug CE can still phone home. Have a favorite flavor of reverse shell pwnzorship? Plain old reverse SSH is available or shell over DNS, HTTP, ICMP, SSL, or via 3G if you have the likes of an O2 E160.
The supporting scripts for reverse shell on the Pwn Plug are found in /var/pwnplug/scripts.
On your SSH receiver (Backtrack 5 recommended) I suggest checking out the PwnieScripts for Pwnie Express from Security Generation. @securitygen even has a method for setting up reverse SSH over Tor. I configured the Pwn Plug for HTTP because who doesn’t allow HTTP traffic outbound? J

Figure 3: Have shell, will pwn
Access established, time to pwn. One of my all-time favorite collections of mayhem is the Social Engineer Toolkit (SET). You will find SET at /var/pwnplug/set. Change directories appropriately via your established shell and run ./set.  You will be presented with the SET menu. I chose 2. Website Attack Vectors, then 3. Credential Harvester Attack Method followed by 2. Site Cloner (SET supports both HTTP and HTTPS). In an entirely intentional twist of irony I submitted http://mail.ccnt.com/igenus/login.php to SET as the URL to clone. Mind you, this is not a hack of the actual site being cloned so much as it is harvesting credentials via an extremely accurate replica wherein usernames and passwords are posted back to the Pwn Plug.
The test Pwn Plug was set up in the HolisticInfoSec Lab with an IP address of 192.168.248.23.
Imagine I’ve sent the victim a URL with http://192.168.248.23 hyperlinked as opposed to http://mail.ccnt.com/igenus/login.php and enticed them into clicking. Now don’t blink or you’ll miss it; I froze it for you in Figure 4.
Figure 4: SET harvesting from Pwn Plug
 After passing credentials the victim is then redirected back to the legitimate site none the wiser.
All the while, because you have shell access, you can gather results at your discretion. SET has a nice report generator and writes out to XML or HTML.
This is the tip of the iceberg for SET, and a mere fraction of the chaos you can unleash in whisper quiet mode via Pwn Plug. There are simply too many options to do it much justice in such short word space so as mentioned earlier I’ll continue the conversation on the HolisticInfoSec blog.

In Conclusion

I had a blast testing Pwn Plug, this is me after spending days doing so.


 If you make your living as penetration tester or need a really capable demonstration tool for social engineering awareness and prevention training, Pwn Plug is for you. Grab yourself a Sheevaplug, download Pwn Plug CE and enjoy yourself (with permission)!
Ping me via email if you have questions (russ at holisticinfosec dot org).
Cheers…until next month.

Acknowledgements

Dave Porcello, CEO and Technical Lead, Pwnie Express

Wednesday, February 22, 2012

A Tribute to Tareq

This past Sunday we lost an extraordinary human being.
Tareq Saade perished doing something he loved as his was an adventurous spirit. My heart breaks for his family and his girlfriend Cindy, and as profound as my own sadness is, I can't begin to imagine their grief. My most sincere condolences are theirs. Tareq's family has asked that you donate to Red Cross in his memory; one of the many ways he gave was as a Red Cross volunteer. West Seattle Blog's post regarding his impact on the community he embraced is also a kind remembrance.
Tareq was one of those rare people about whom I have only ever heard good (great) things said.
Kind, brilliant, smart, funny, bright, giving, sharing, engaging, the list is endless and only does partial justice to his character.
To my regret I really only knew Tareq in a professional capacity as part of the information security community at Microsoft. Yet even in that limited scope I can say that I am surely better for having known him. If ever I had a question of him (he was expert in malware analysis and threat intelligence) it was often mere minutes in which he replied and always with a passion for the subject. For his 29 years he was worldly and I always learned something from him given both his deep intellect and his profound willingness to share. It was not for Tareq to be didactic as much as it was to be a natural mentor, again beyond his years.
It was my distinct privilege to have written an article with him and shared the stage with him as we co-presented at a Seattle-area information security gathering two years ago.
Much of the research I have conducted in recent years is touched by his generosity as he often provided samples, captures, feedback, or simply interest. Tareq was an ally against the Internet's evil denizens and our community will long mourn him while continuing to serve in his honor.
I imagine amateur radio operators will listen for W7TJS and feel the loss in the silence.
I imagine those he climbed with, those he dove with, those he worked with, those he gave with, and those he lived with will miss Tareq always. Ours is a lesser world without him.
When I first met Tareq, so as to ensure correct pronunciation, I asked him how to properly say Saade.
With a smile he said to me "It's easy, just like 'sad day'."
That it is, my friend, that it is.

I grieve for you, Tareq, I salute you, and I will miss you. Godspeed.


Friday, February 03, 2012

toolsmith: Splunk app - Windows Security Operation Center


Prerequisites
Windows 2003, 2008, 7

Introduction
As a volunteer handler for the SANS Internet Storm Center, I am privileged to work with some incredibly bright, highly capable information security professionals. As said individuals create new tools or update those they maintain I have the advantage of early awareness and access. Bojan Zdrnja’s Splunk app, Windows Security Operations Center (referred to as WSOC hereafter) is a perfect example. By the time you read this a new version should be available on Splunkbase.
Bojan bought me up to speed on his latest effort via email.
The latest version of WSOC contains bug fixes (mainly minor search tweaks) along with a couple of new dashboards:
1.       A dashboard for up-to-date servers with patches
2.       Directory Services dashboards
The Directory Services dashboards are very useful as they show changes to objects in AD including creations, deletions, and modifications. These views are excellent for auditors.
In the future Bojan plans to add support for other products normally found in Microsoft environments, including infrastructure elements such as DNS/DHCP, IIS, SQL server, and perhaps TMG. WSOC’s primary purpose is to cover all potential security views an auditor or information security personnel might want purview of; there’ll be no run-of-the-mill operational monitoring here ;-).
Bojan offered many favorite use cases. People are not always aware of what's going on in their Windows environments. In almost every implementation he’s encountered he found automated tools/services filling logs in abundance. As an example, when the tool tries to access a resource automatically, it generates an AD authentication failure event and then it successfully authenticates through NTLM. This causes logs to grow substantially. The same dashboards can be used to easily spot infected machines or brute force attacks on the network, thanks to Splunk's excellent visualization capabilities. WSOC includes a table that shows a distinct count of failed login attempts per username per machine, so if a machine is brute forcing, even if it's slow, you'll be able to see it.
Auditors are particularly fond of the user/group management dashboards. They produce ready evidence, in one view, of which users were added to which group. When coupled with change requests, yours becomes an organization that is then better prepared for audits.
The dashboard showing installed services supports this well too as any installed service should have an accompanied change request (see further discussion below).
Bojan wanted to stress the missing patches dashboard as extremely valuable. This information is collected from the local Windows Update agent on every server. Of course, in order for it to be accurate, the Windows Update agent must be able to connect to WSUS or Microsoft's update server, but assuming it can, results will populate nicely showing servers that have missing patches and those that are all up to date.

Windows Security Operation Center installation

You’ll need a Splunk installation to make use of WinSOC. I’ll assume you have some familiarity with Splunk and its installation. If not, ping me via russ at holisticinfosec dot org and I’ll send you copy of a detailed Splunk article I wrote for Admin magazine in June 2010. You can also make use of the extensive online Splunk documentation resources.  
A panoply of Splunk application goodness is available on the Splunkbase site, WSOC included. For the easiest installation method, from the Splunk UI, click App | Find More Apps…, then search Windows Security Operations Center followed by clicking the Install Free button. 
Alternatively if you’ve acquired the .tar.gz for the app you can, again via the Slunk UI navigate to App | Manage Apps… | Install app from file and select the app from the location you’ve downloaded it to. Installation is also possible from the Splunk CLI.
Once installed WSOC will present itself from the Splunk menu under App as Windows Security Operations Center. Once you’ve navigated to the WSOC app, options will include:
·         About
o   Includes top sending servers, top source types, and contributing Domain Controllers (if applicable)
·         Login Events
o   Includes Active Directory, NTLM, and RDP successful and failed attempts
·         Directory services
o   Access and changes
·         User management
o   User Account and Group Management
·         Change Control
o   Advanced Activity Monitor
o   Windows Installations and Patch Status Overviews
o   Process Tracking
o   Time Synchronization
·         Windows firewall
o   Configuration changes
o   Allowed and blocked connections
o   Allowed and blocked binds
·         Saved Searches               
o   Preconfigured queries, too plentiful to list
·         Search
o   Standard Splunk search UI

You’ve got to remember to set your audit and logging policies to be sure they capture the appropriate level of success and failure in order to be properly indexed by Splunk from the security event log. Recognize the profound differences between Window Server 2003 and 2008 with special attention to Event IDs. WSOC is largely optimized for Windows 2008/7 event types but can be tuned for older versions if you know how to manage Splunk app configurations and query parameters.
Remember too that you can configure Splunk as a light forwarder (CLI only) on target Windows servers and send all events to a core Splunk collector running WSOC, thus aggregating all events in one index and UI. Note the 500MB a day limitation on the free version of Splunk.

Using Windows Security Operations Center

I ran WSOC through its paces on a Windows Server 2003 virtual machine image that I literally had not touched in two years (prior snapshot: 9/11/09). With WSOC and Splunk installed I patched the VM and generated a number of different logon events via RDP and locally. I also made changes to users and groups as well as updated browsers, Flash, and Java.
WSOC smartly reported on all related activity.
Under Change Control | Windows Installation Overview I noted all installations that wrote to the security event log (the default WSOC monitored log source) as seen in Figure 1.

Figure 1: WSOC Windows installation details   
As configured out of the box, if an event is not written to the security event log WSOC will not pick it up. As Bojan said, this app is intended as a security auditor’s tool as opposed to an operational health tool.
The default search covers the last 7 days from query time but the chronology drop down menu offers a range from 15 minutes to All time.  Licensed versions of Splunk can also leverage real time reporting.
Process Tracking is also great view to monitor on critical servers. Unwelcome or unfamiliar processes may jump out at you particularly if you’ve baselined normal expectations for your systems.
I am currently not running Active Directory or a domain controller in my lab which left a lot of WSOC functionality testing off the table (Directory Services, etc.) but that should not preclude you from doing so. Via Local Users and Groups I added an evil user, deleted some users created during testing on the VM in 2009, and deleted a couple of non-essential groups. Evidence of the activity immediately presented itself via User management | User Account Management and Group Management as seen in Figure 2.

Figure 2: WSOC user account monitoring
It’s a tad unseemly for WSOC to label UI panes as Added Windows Domain accounts and Deleted Windows Domain accounts given that the activity was local account specific, but you get the idea.
If you drill into View results you’ll receive all the detail not immediately available in the preliminary app pane.
Figure 3 shows WSOC nabbing me for having created the user Ima, short for Ima Hacker. J

Figure 3: Ima Hacker bagged and tagged
I love the Saved Search feature and ran Windows – Server restarts for you as an example knowing I’d intentionally triggered one of those events.
Results are noted in Figure 4 where you can see the fact that the reboot was spawned by Internet Explorer (Windows Update).

Figure 4: WSOC captures system restarts 
Lastly, the Advanced Activity Monitor, under Change control, offers search capacity via unique identifiers. In Figure 5, you’ll see all the New added services attributed to my user account.

Figure 5: WSOC shows added services 
I did some customization of the app to capture Windows Server 2003 Windows Firewall-related events but be aware that by default the app checks events 4946, 4947, 4948, 5156, 5157, 5158, and 5159 (Windows Server 2008 Event IDs). Enable Audit MPSSVC Rule-Level PolicyChange on Windows 7 and 2008 for this to capture Window Firewall events correctly. Windows 2003 Event IDs are a different event code hierarchy that is not covered by WSOC but is east enough to customize for if you’re still running 2003.
I imagine you can see the value in WSOC, particularly from an audit and awareness perspective. The nice thing about Splunk apps is they can be enhanced and built upon with relative ease. Bojan and team also offer a supported, licensed version so that’s an option for you as well.

In Conclusion

WSOC is slick, particularly for teams already making use of Splunk. Once (or if) you’re comfortable with Splunk, you’ll find that apps such as WSOC and others make it invaluable for centralized, correlated data.
Again, if you want to read deeper dives into the power of Splunk and apps, ping me via email if you have questions (russ at holisticinfosec dot org).
Cheers…until next month.

Acknowledgements

Bojan Zdrnja, project lead, INFIGO IS

Wednesday, February 01, 2012

2011 Toolsmith Tool of the Year: OWASP ZAP


Congratulations to the OWASP ZAP team!
The Zed Attack Proxy is the 2011 Toolsmith Tool of the Year.
ZAP finished with 338 votes (36.5% of the total), slightly edging out Security Onion.
SO finished a strong second place with 328 votes (35.4%).
Volatility came in third with 152 (16.4%) and Armitage right on their heels in fourth with 148 votes (16%).

I am donating $50 to the OWASP ZAP project to honor this win.
I ask that those of you with the wherewithal and resources to do so please visit the project page and donate in any capacity you can.

Congratulations and thank you to all participants this year and I look forward to a strong 2012.


Thursday, January 05, 2012

toolsmith: ZeroAccess analysis with OSForensics


Prerequisites
Windows

Happy New Year: “A New Year's resolution is something that goes in one year and out the other.” - Author Unknown


Introduction
December is the time of year when I post the Toolsmith Tool of the Year survey for reader’s to vote on their favorite tool of the given year. Please do take a moment to vote. What’s nice is that I often receive inquiries from tool developers who would like consideration for coverage in toolsmith. David Wren, Managing Director, of PassMark Software caught me at just the right moment as I was topic hunting for this month’s column. PassMark, out of Sydney, Australia, has been known for benchmark and diagnostic tools but has recently dipped its tow in the digital forensics pool with OSForensics. I give PassMark props for snappy marketing. OSForensics, “Digital Investigation for a new era” coupled with the triumvirate of Discover, Identify, and Manage makes for a good pitch, but as always we need tools that do as they do, not as they say. So what can we expect from OSForensics? According to David, who provided me with prerequisite vendor/developer content, the pending 1.1 release of OSForensics expected in mid-January 2012 will include:
·         Inclusion of a tree view style file system browser (Windows Explorer replacement).
·         Indexing & searching of the contents of E-mail attachments. At the moment just the E-mail content and the file names of attachments are indexed.
·         Improvements to add search results to a case directly from search history (efficiency improvement)
·         Ability to add quick notes to a case. At the moment adding arbitrary notes is a 2 step process.
·         Improvements in the built-in image viewer. Better quality image scaling & more file properties.
·         Minor improvements in the way E-mails are exported
·         Significant speed improvements in the window's registry browser
·         A bug fix for handling of dates in Spanish language E-mails.
·         Some minor documentation changes

Existing features include disk imaging, disk image mounting, raw hex view of disk,  manual carving, a registry viewer, forensic copy of network files, testing & zeroing of external drives prior to imaging, file hashing, live memory dumping, detection of files with wrong extensions via signatures, case management, reporting, 64bit  support, and more.
The OSForensics website has an extensive FAQ as well excellent videos and tutorials.
Please note that there is a Free Edition and a Pro Edition. For this article I tested the 1.0 Pro version of OSForensics.

Integrating additional tools into OSForensics

One of the things I like most about OSForensics is the ability to plug in other tools. There’s a great tutorial for enhancing OSForensics with Harlan Carvey’s RegRipper that will give you a solid starting point for this activity. Friend and reader Jeff C. expressed interest in rootkit analysis this month so I’m going to use this opportunity to integrate GMER and RootkitRevealer into OSForensics.
As I ran OSForensics on a Windows XP system from a USB key, I copied GMER and RootkitRevealer to E:\OSForensics\AppData\SysInfoTools.
I then navigated to System Information in the OSForensics UI, selected Add List and created a Rootkit Analysis list, followed Add under Commands and added the command to execute GMER and RootkitRevealer as seen in Figure 1.
Figure 1: Rootkit Analysis tools added
Keep in mind, you can add any of your preferred tools to OSForensics and their execution as well as their output will be captured as part of OSForensics case management capabilities.

Running OSForensics

For ease of viewing, right-click the menu on the left side of the OSForensics UI and choose thin buttons as this will present all options without scrolling.
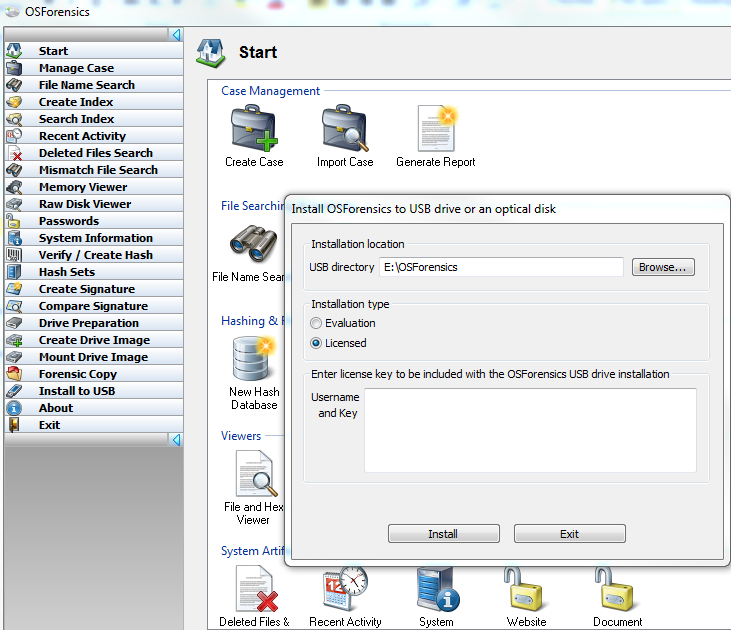
One note of interest before diving in: OSForensics allows installation on a base analysis system from which you can then Install to USB so as to run it from a USB key as part of your field kit as seen in Figure 2.

Figure 2: Install OSForensics to a USB key
Jeff, as part of his expressed interest in rootkit analysis, also provided me with a perfect sample with which to compromise my test system. Nomenclature for this little nugget includes Jorik and Sirefef but you may now it best as Zaccess or ZeroAccess. To read a truly in-depth study of ZeroAccess, check out Giuseppe Bonfa’s fine work in four parts over at InfosecResources, as well as a recent update from Pedro Bueno on the ISC Diary. ZeroAccess has been rolled into the BlackHole Exploit Kit and is often used in crimeware bundles for ad clicking.
This particular sample (MD5: 3E6963E23A65A38C5D565073816E6BDC) is VMWare-aware so I targeted my Windows XP SP 3 system running Windows Steady State and executed QuickTimeUpdate.exe (it only plays a real QuickTime update on TV).  
As with any tool of OSForensic’s ilk, I started the process by creating a case which is as easy clicking Start then Create Case. The OSForensics UI is insanely intuitive and simple; if you’re one of those who refuses to read manuals, FAQs, and/or tutorials you’ll still get underway in short order. With most forensics oriented multi-functional tools that include indexing I always make indexing my second process. Yep, it’s as easy as Create Index. I infected this system on 12/26/11 at 1630 hours so a great next step for me was to review Recent Activity to see what was noteworthy. Based on a date range-limited search under Recent Activity I noted a significant spike in events in the 1600 hour. I right-clicked on the resulting histogram for the hour of interest and selected Show these files. The result, as seen in Figure 3, shows all the cookies spawned when ZeroAccess tapped into all its preferred ad channels. All cookies in Figure 3, including those for switchadhub.com, demdex.com, and displayadfeed.com were created right on the heels of the infection at 1630 hours. These are services malware writers use to track clicks and campaign success.

Figure 3: ZeroAccess’ malicious click campaign evidence via OSForensics
I had not browsed to any websites and on this host would have done so via a browser other than Internet Explorer; as such this activity as written to C:\Documents and Settings\LocalService\LocalSettings\Temporary Internet Files\Content.IE5 clearly occurred in the background.
I always take a network capture during malware runtime and the resulting PCAP acquired while analyzing this version of ZeroAccess included connections to a well-known malware redirection service at 67.201.62.*. Search "67.201.62" malware and you’ll see what I mean.

I then opted to call GMER from OSForensics as discussed earlier during Integration. If you’re not familiar GMER is the defacto standard for rootkit detection. Once a GMER scan is complete, you can choose to dump detected modules as seen in Figure 4 via Dump module.

Figure 4: GMER bags ZeroAccess via OSForensics
I fed the resulting binary file to VirusTotal and was rewarded for my efforts with hits for Gen:Variant.Sirefef.38, a ZeroAccess variant.
OSForensics features a Memory Viewer from which you can conduct similar activity natively by selecting a given process (one you assume or have determined is malicious), select one of four dump options including Dump Process Memory Contents, then click Dump. The resulting .bin can be fed to VirusTotal or a similar service.
But alas, you will not have made the utmost use of OSForensics if you don’t capitalize on Hash Sets. I won’t get into great detail as to how to do so as again the tutorial videos are excellent. You will want to enable a given hash set by selecting it in the UI then clicking Make Active. One of the hash sets PassMark offers via download is a 124kb common Keyloggershash set. You can select a directory via File Name Search, then Search, then right-click a file of interest (or CTRL-A to select all) and choose Look Up in Hash Set. As none of the acquired binaries for ZeroAccess matched the current hash set, I chose to scan my Lurid (the APT) analysis folder to see what matches the hash set had for me. I used the Sorting menu in the lower right-hand corner of the UI and set it to In Hash Sets; the results are seen Figure 5.

Figure 5: Keylogger hashset checks
While OSForensics claimed to have matches, they were only for 0 byte files that all show up with the MD5 hash of D41D8CD98F00B204E9800998ECF8427E. I’ll test this further with a known keylogger and determine what a real match looks like. I don’t fault OSForensics for this as I likely don’t have a sample keylogger whose hash matched the hash set. Trying hash matching against known good system files worked admirably.

I didn’t even touch OSForensics password analysis capabilities but will also likely do so in a future blog post. Do check out that feature set via Passwords for yourself and share your feedback. Recognize that OSForensics integrates Rainbow Tables so as you can imagine, the possibilities are endless.
Don’t forget the expected disk image analysis capabilities coupled with file carving. I tested this briefly (and successfully) only to confirm what I consider a required and standard feature for tools of this nature.

In Conclusion

I’ll admit I had no expectations for OSForensics as I had no prior experience with it and to be quite candid, no awareness prior to David contacting me. I always assume some risk when choosing such a tool given that I could spend hours conducting research and analysis only to find the tool does not meet the standard for toolsmith discussion (can you say emergency topic change?”). Such was not the case with OSForensics. I was pleased with the results, disappointed I didn’t have more time to spend on it before writing about it here, but looking forward making much more use of it in the future. As always, let me know what you think, I’m hopeful you find it as intriguing as I have.
Ping me via email if you have questions (russ at holisticinfosec dot org).
Cheers…until next month.

Acknowledgements

David Wren, Managing Director, PassMark Software


Tuesday, December 20, 2011

Choose the 2011 Toolsmith Tool of the Year

Merry Christmas and Happy New Year!
It's that time again.
Please vote below to choose the best of 2011, the 2011 Toolsmith Tool of the Year.
We covered some outstanding information security-related tools in ISSA Journal's toolsmith during 2011; which one do you believe is the best?
I appreciate you taking the time to make your choice.
You can review all 2011 articles here for a refresher on any if the tools listed in the survey.
You can vote through January 31, 2012.
Results will be announced February 1, 2012.

Friday, December 02, 2011

toolsmith: Registry Decoder


Prerequisites
Binaries require no external dependencies; working from a source checkout requires Python 2.6.x or 2.7.x and additional third-party apps and libraries.

Merry Christmas: "Christmas is not a time nor a season, but a state of mind. To cherish peace and goodwill, to be plenteous in mercy, is to have the real spirit of Christmas.” -Calvin Coolidge

Introduction
Readers of the SANS Computer Forensics Blog or Harlan Carvey’s Windows Incident Response blog have likely caught wind of Registry Decoder. Harlan even went so far as to say “sounds like development is really ripping along (no pun intended). If you do any analysis of Windows systems and you haven't looked at this tool as a resource, what's wrong with you?” When Registry Decoder was first released in September 2011, I spotted it via Team Cymru’s Dragon News Bytes mailing list and filed it away for future use. Then, in most fortuitous fashion, Andrew Case, one of the Volatility developers I’d reached out to for September’s Volatility column, contacted me regarding Registry Decoder in early November. Andrew co-develops Registry Decoder with Lodovico Marziale as part of Digital Forensic Solutions and kindly provided me with content for the remaining entirety of this introduction.

Registry Decoder is open source (GPL) and written completely in Python and is downloadable via Google Code projects. It was initially funded by the National Institute of Justice and now is funded by Digital Forensics Solutions.
Registry Decoder was devised to automate the acquisition, analysis, and reporting of registry contents. To accomplish this, there are actually two projects. The first is RegistryDecoder Live which allows for the safe acquisition of registry files from a live machine by forcing a system restore point, thus putting the currently active registry files into a read-only state in backup. It then reads these files from backup either in System Restore Points for XP or from the Volume Shadow Service on Windows Vista & Windows 7. As Registry Decoder Live acquires files, it creates a database that can then be imported into the second tool, Registry Decoder.
Registry Decoder can analyze registry files from a number of sources and then provide a number of GUI-driven analysis capabilities. The current version of the tool (1.1 as this is written) can import individual registry files, raw (dd) disk images, raw (dd) split images, Encase (E01) images, and databases from the live tool. Once evidence is imported and pre-processed, the investigator then has a number of analysis tools available and new evidence can be added to a case at any time.
Registry Decoder’s analysis capabilities include:
·         Browsing Hives (similar to Access Data’s Registry Viewer)
·         Hive Searching (more on this below)
·         Plugin System (similar to regripper)
·         Hive Differencing
·         Timelining based on last write time
·         Path Based Analysis
·         Automated reporting of all of the above
Registry Decoder automates all of this functionality for any number of registry hives and the reporting can handle exporting results from multiple hives and analysis types into one report.

Andrew’s favorite Registry Decoder use case is USBSTOR analysis. Almost every case involving investigating a specific employee requires determining which (if any) USB drives were in use.  To do this with Registry Decoder, all an investigator has to do is create a case with the disk images or hives acquired, run the USBSTOR plugin, and then export the results. After pre-processing is done, it takes mere minutes to have a report created with the device name, serial number, etc. of any devices connected. Also, since Registry Decoder pulls historical files from live machines and disk images (System Restore & Volume Shadow Service), this analysis can be run across hives going back months or years.
Similarly, while investigating data exfiltration between multiple employees of a company, Andrew needed to know if they shared USB drives. To make the determination he took the SYSTEM files from each machine, loaded them into Registry Decoder and then used the plugin differencing ability on the USBSTOR plugin. It immediately revealed what drives were shared between computers, including their serial number.  Another common use of the differencing feature is with the Services plugin as this quickly identifies malware if you difference your known good disk image vs. a disk image of a machine suspected to be infected.

Registry Decoder’s search feature is one of its strongest features. It allows you to search across any number of hives and filter by keys/values/names, last write time range, wildcard searching, and bulk searching with keyword files.
For a recent case, Andrew had to determine if a person was accessing files they shouldn’t have been looking at. They had a desktop and a laptop, both running XP and both with many System Restore Points. In less than 30 minutes with Registry Decoder, Andrew needed only load the disk images from the two machines into Registry Decoder, make a text file with all the search terms, and then search all the terms across all the hives in the case (including historical ones). This returned results that he then exported into one report and was finished.  Another useful search is noted when viewing the search results tab, right click on any result, and immediately jump into the Browse view positioned at that key.

Another good use case includes path-based analysis which allows you to determine if a registry path exists in any number of files. For whichever files it is present in, one can then export the path and optionally its key/value pairs. This is extremely useful in two situations:
1.       Determining if certain software is installed (P2P, cracked software, etc.), as you can simply search any of the paths that the program creates and then export its key/values inclusive of when and where the software was installed.
2.       During malware analysis as most malware writes to the registry. Searching across numerous suspect systems for the malware’s path allows investigators to immediately determine the extent of infection.

Registry Decoder’s roadmap includes more analysis plugins and added support for memory analysis (integrate with Volatility’s existing in-memory registry functionality).
The developers also want to add support for analyzing previously deleted keys and name/value pairs within hives. The library utilized for enumerating hives, reglookup, already supports this functionality so it is just a matter of integration.


Running the Registry Decoder online acquisition component

I ran regdecoderlive32 on a 32bit Windows XP SP3 virtual machine infected with Lurid and regdecoderlive64 on a Windows 7 SP1 64bit machine.
One note for regdecoderlive32 on Windows XP systems with drives formatted with NTFS. Even when running regdecoderlive32 with administrator privileges the hidden System Volume Information directory is protected with unique ACLs. To circumvent this issue, issue cacls "C:\System Volume Information" /E /G :F from a command prompt at the root of C: (this assumes the OS is installed on C:).
As seen in Figure 1, running regdecoderlive is as simple as executing and defining a few parameters including description, output directory (must be empty) and check boxes for acquisition of current and backup files.

Figure1: Registry Decoder Live
Once acquisition is complete, the results directory will be populated with registryfiles/acquire_files.db and related files. This results directory can (should) be written to portable storage mounted on the target system or a network share, which can then be consumed by Registry Decoder for offline analysis.

Running the Registry Decoder offline analysis component

Registry Decoder can consume individual registry files, raw (dd) disk images, and Encase (E01) images, including split images. Building a case is as easy as adding a case name and number, investigator, comments, and case directory. Adding evidence to a case after initial processing is created is quite simple; you’ll be prompted to add new evidence after choosing Start Case and opening an existing case.
I only tested Registry Decoder with the acquisition database acquired from a Lurid-infected Windows XP VM via Registry Decoder Live.
Initial processing can take some time depending on the number of restore points or volume shadows.
Once initial processing is complete however, Registry Decoder is nimble and effective.
I mimicked some of Andrew’s use cases in this analysis of a Lurid victim. From runtime analysis of the Lurid sample I had (md5: 84d24967cb5cbacf4052a3001692dd54) I knew a few key attributes to test Registry Decoder with. Services and registry keys created include WmdmPmSp. As the search functionality is a strong suit, I selected CORE from the current snapshot acquired and searched WmdmPmSp. Right-click search results and select Switch to File View then navigate to the Browser tab for key values, etc. as seen in Figure 2.

Figure 2: Registry Decoder search results
I made use of the timeline functionality and was amply rewarded. Imagine a scenario where have a ballpark time window for a malware compromise or unauthorized access. You can filter the timeline window accordingly and produce output that is compliant to the SleuthKit’s mactime format. It’s not human readable currently (next release) so read it in with Autopsy or TSK. Timeline gathering and results are combined in Figure 3. It clearly identified exactly when Lurid wrote to HKLM\SYSTEM\CONTROLSET001\SERVICES\WmdmPmSp.
Figure 3: Registry Decoder timeline results
I also tested USBSTOR (unrelated to Lurid) on both acquisitions (Windows 7 and Windows XP) and the results were accurate and immediate in both cases as seen Figure 4.

Figure 4: Registry Decoder USBSTOR results
Explore the Plugins options included with Registry Decoder, the possibilities are endless. SYSTEM will provide you a nice summary overview as you begin, IE Typed URLs is great for inappropriate browser use, Services with Perform Diff enabled is excellent for malware hunting, System Runs will give you instant gratification regarding what’s configured to run on startup, ACMRU queries the registry keys that have been typed into the Windows Search dialog box, and on and on and on. J Brilliant!

In Conclusion

I’m extremely excited about this tool and imagining its use at scale to be of incredible use for enterprise incident responders and forensic examiners. I’ve been chatting with Andrew at length while writing this and he continuously mentions pending features including some visualization options and the aforementioned Volatility interaction. I can’t wait; check out Registry Decoder out for yourself ASAP.
Merry Christmas!
Ping me via email if you have questions (russ at holisticinfosec dot org).
Cheers…until next month.

Acknowledgements

Andrew Case, Registry Decoder developer and project lead

Saturday, November 26, 2011

Tool review: NetworkMiner Professional 1.2

I've been slow in undertaking this review as NetworkMiner's Erik Hjelmvik sent me NetworkMiner Professional 1.1 when it was released and 1.2 is now available.
Seeing Richard Bejtlich's discussion of Pro 1.2 has served to get me off the schnide and is helpful as I will point you to his post as an ideal primer while I go into to a bit deeper detail as to some of NetworkMiner's power as well as what distinguishes Professional from the free edition.
I covered NetworkMiner in toolsmith in August 2008 back when it was version 0.84. Erik has accomplished all of his goals for improvement as identified in the article including reporting, faster parsing of large PCAP files (.735 MB/s at the command-line),  more protocols implemented, and PIPI (Port Independent Protocol Identification). NetworkMiner Professional 1.2 incorporates all of the above.
To exemplify NetworkMiner Professional's PIPI capabilities, I changed my lab web server port to 6667, then set NetworkMiner to grab a live capture while browsing to the reconfigured server.
Note: you need to Run as Administrator to grab the interface on Windows 7.
Sure, it's more likely that someone would be more likely to hide evil traffic over port 80 but you get the point. As Richard said, "PIPI has many security implications for discovery and (preferably) denial of covert channels, back doors, and other policy-violating channels."
Note as seen in Figure 1 that NetworkMiner Professional clearly differentiates HTTP traffic regardless of the fact that it traversed port 6667.

Figure 1
I was a bit surprised to note that the Hosts view as seen in Figure 1 did not identify that any data was pushed as cleartext although it unequivocally identified the admin/password combination I sent in both the Cleartext view and the Credentials view.
I used an 18.8MB PCAP from the Xplico sample set as it includes a plethora of protocols and carve-able content with which to test NetworkMiner Professional.
Exporting results to CSV for reporting is as easy as File --> Export to CSV and selecting output of your choosing. As seen in Figure 2 I opted for Messages as NetworkMiner Professional cleanly carved out an MSN to Yahoo email session (HTTPS, anyone?).

Figure 2
Geo IP localization is a real standout too. You'll see it in play as you explore host details in Hosts view as seen in Figure 3.
Figure 3
You may find host coloring useful too should you wish to tag hosts for easy identification later as seen in Figure 4.

Figure 4
Finally, I am most excited about NetworkMinerCLI for command-line scripting support. 
I ran a PCAP taken from a VM infected with Trojan-Downloader.Win32.Banload.MC through NetworkMinerCLI and was amply rewarded for my efforts...right after I excluded the output directory from AV detection.
Figure 5 shows the command executed at the prompt coupled with the resulting assembled files and CSVs populated to the output directory as seen via Windows Explorer.

Figure 5
The assembled files included all the malicious binaries disguised as JPGs as downloaded from the evil server. File carving network forensic analysis juju with easy CLI scripting. Bonus!

In closing, NetworkMiner Professional 1.2 is a mature, highly useful tool and well worthy of consideration for purchase by investigators and analysts tasked with NFAT activity. 
I'm glad to provide further feedback via email and recommend you reach out to Erik as well via info [at] netresec.com if you have questions.


Moving blog to HolisticInfoSec.io

toolsmith and HolisticInfoSec have moved. I've decided to consolidate all content on one platform, namely an R markdown blogdown sit...