Friday, October 02, 2015

toolsmith #109: CapLoader network carving from Rekall WinPmem Memory Image

With some of my new found flexibility (not bound to print deadlines) I'm now able to provide near-realtime toolsmith content in direct response to recommendations or interaction via social media (@holisticinfosec), and other avenues. Just another service provided by your friendly neighborhood toolsmith. :-) Such is the case as we discuss Erik Hjelmvik's CapLoader. We're connecting a few strands in our beautifully enmeshed community here. First, we discussed Erik's outstanding NetworkMiner in November 2011. Erik's tools have done nothing but improve since, and CapLoader, as part of those regular improvements, came to fruition to answer the "large file" problem. Second, in May 2015, when I discussed Hunting in-memory adversaries with Rekall and WinPmem I created a fairly sizable memory image (5GB) that included network activity from a compromised host to an attacker-controlled resource. When, via Twitter, I announced that I'm presenting related content to a 2015 Northwest Regional ICAC Conference audience on 5 OCT, Erik replied to remind me that, if I hadn't already, to try and carve packets from my memory dump with CapLoader, and that I'll be amazed. As a jaded, crusty, and exponentially aging security practitioner, I'm not easily amazed, so I took the challenge and told him "I'm going to do u one better. Next #toolsmith to be about CapLoader inspecting the memory image specifically created for this talk." And here we are! The HolisticInfoSec circle of life.


As CapLoader's network carving from memory feature has been available for more than a year, and it was nicely written up for you on the Netresec blog, I'll point you to Erik's March 2014 post as your starting point, along with the above mentioned WinPmem/Rekall article. CapLoader is easily downloaded and installed on modern Windows systems, your only dependency is .NET Framework 4.0. The free version will provide all the network packet carving magic you need, but I also tested the commercial version with a license provided by Erik.
I'm going to give you some perfomance benchmarks as well as we go along.
Here's how easy it was to put CapLoader 1.3.1 Trial to use on the compromised.raw memory image from the WinPmem/Rekall article.
  1. Opened CapLoader
  2. Selected File then Carve Packets from File
  3. Selected compromised.raw from Open dialog
  4. Under Input Settings, left Create Gantt chart, Build hosts list, and Parse DNS enabled. The additional options aren't available in the free version. We'll discuss the licensed version features and performance below,
  5. Left all Carving Options enabled and clicked Start as seen in Figure 1.


Figure 1: CapLoader memory image network carving options
Exactly 76 seconds later, the free, trial version of CapLoader extracted 32 flows from 23 hosts from a 5GB memory image acquired via WinPmem. Sorry, this isn't amazing, it's amazeballs. I can't express how fast that is for functionality of this nature. There, awaiting further analysis, was compromised.raw.pcapng. Better still, I wanted to just focus on flows for two hosts, 192.168.177.130 (attacker) and 192.168.177.129 (victim). CapLoader includes an Auto-extract flows on select feature, I just highlighted these two flows, and BLAM!, they were written out to a new PCAPNG file as seen in Figure 2.

Figure 2: Selected flows
Just double-click the PCAP CapLoader logo in the upper-right quadrant of the CapLoader UI and it'll open the selected flows in Wireshark (if installed) automatically. You can also just click File then Save Selected Flows. In addition to Wireshark analysis, what's the most obvious next step given that we're talking about a Netresec tool here? Yes! Use NetworkMiner. One small note: if you have any issues moving between PCAPNG and PCAP files (the free version of NetworkMiner doesn't open PCAPNG files) you can use PcapNG.com (also a Netresec service) to convert captures smaller than 8MB.
I repeated the exercise with the commercial version of CapLoader with two additional features enabled, Identify Protocols and Show Countries, and in 72 seconds (four seconds faster than our first run with the trial version) had my results.
After all this though, the resulting network capture was not much use as I had pushed my Meterpreter session for the Rekall discussion over HTTPS, but you get the point. Had network traffic ensued via a clear-text protocol, CapLoader's ability to rapidly carve it out of a memory image would have been invaluable.
To prove that point, I'll give you one quick unrelated example. Using the commercial copy of CapLoader, I loaded a different memory image where misuse of MSN Messenger was in play. In exactly 22 seconds for this 1GB memory image, and a bit of column sorting, I was able to instantly visualize the Messeger traffic using the CapLoader Gantt feature as seen in Figure 3.

Figure 3: CapLoader Gantt chart visual
CapLoader is wonderful stuff indeed from Erik and Netresec, loved the suggestion to explore it in the context of the Hunting in-memory adversaries with Rekall and WinPmem presentation, and as always, look forward to what's next from Erik. Follow Erik via @netresec and ping me via email or Twitter if you have questions (russ at holisticinfosec dot org or @holisticinfosec).
Cheers…until next time.

Wednesday, September 02, 2015

toolsmith #108: Visualizing Network Data with Network Data

Prerequisites

R development environment (R, RStudio)

This month finds us in a new phase for toolsmith as it will not be associated with ISSA or the ISSA Journal any further. Suffice it to say that the ISSA board and management organization decided they no longer wanted to pay the small monthly stipend I’d been receiving since the inception of the toolsmith column. As I am by no means a profiteer, I am also not a charity, so we simply parted ways. All the better I say, as I have been less than satisfied with ISSA as an organization: Ira Winkler and Mary Ann Davidson should serve to define that dissatisfaction.
I will say this, however. All dissatisfaction aside, it has been my distinct pleasure to write for the ISSA Journal editor, Thom Barrie, who has been a loyal, dedicated, committed, and capable editor and someone I consider a friend. I will miss our monthly banter, I will miss him, and I thank him most sincerely for these nine years as editor. The ISSA Journal is better for his care and attention. Thank you, Thom.
Enough said, what’s next? I’ll continue posting toolsmith here while I consider options for a new home or partnership. I may just stick exclusively to my blog and see if there is a sponsor or two who might be interested in helping me carry the toolsmith message.
I thought I'd use our new circumstances to test a few different ideas with you over the next few months, your feedback is welcome as always, including ideas regarding what you might like to see us try. As always toolsmith will continue to offers insights on tools useful to the information security practitioner, typically open source and free.

To that end, I thought I'd offer you a bit of R code I recently cranked out for a MOOC I was taking. The following visualizations with R are the result of fulfilling a recent assignment for Coursera’s online Data Visualization class. The assignment was meant to give the opportunity to do non-coordinate data visualization with network data as it lends itself easily to graph visualization. I chose, with a bit of cheekiness in mind, to visualize network data…wait for it…with security-related network data.

Data Overview

I gathered data for the assignment from a network traffic packet capture specific to malware called Win32/Sirefef or ZeroAccess that uses stealth to hide its presence on victim systems. This Trojan family runs the gamut of expected behaviors, including downloading and running additional binaries, contacting C2, and disabling system security features. The Microsoft Malware Protection Center reference is here.
The packet capture I used was gathered during a ZeroAccess run-time analysis in my lab using a virtualized Windows victim and Wireshark, which allowed me to capture data to be saved as a CSV. The resulting CSV provides an excellent sample set inclusive of nodes and edges useful for network visualization. Keep in mind that this is a small example with a reduced node count to avoid clutter and serve as an exemplar. A few notes about the capture:
  • Where the protocol utilized was HTTP, the resulting packet length was approximately 220 bytes.
  • Where the protocol was TCP other than HTTP, the resulting packet length was approximately 60 bytes.
  • For tidy visualization these approximations are utilized rather than actual packet length.
  • Only some hosts utilized HTTP, specific edges are visualized where appropriate.
A summary of the data is available for your review after the Graphviz plots at the end of this document.

DiagrammeR and Graphviz

The DiagrammeR package for R includes Graphviz, which, in turn, includes four rendering engines including dot, neato, twopi, and circo. I’ve mentioned Graphviz as part of my discussion of ProcDot and AfterGlow as it is inherent to both projects. The following plots represent a subset of the ZeroAccess malware network traffic data.
- The green node represents the victim system.
- Red nodes represent the attacker systems.
- Orange nodes represent the protocol utilized.
- The cyan node represent the length of the packet (approximate.)
- Black edges represent the network traffic to and from the victim and attackers.
- Orange edges represent hosts conversing over TCP protocol other than HTTP.
- Cyan edges represent the relationship of protocol to packet length.
- Purple edges represent hosts communicating via the HTTP protocol.
Graphs are plotted in order of my preference for effective visualization; code for each follows.

After these first four visualizations, keep reading, I pulled together a way to read in the related CSV and render a network graph automagically.

--------------------------------------------------------------------------------------------------------------------------
Visualization 1: Graphviz ZeroAccess network circo plot


Visualization 1 code

library(DiagrammeR)
grViz("
digraph {
      
      graph [overlap = false]      
      
      node [shape = circle,
      style = filled,
      color = black,
      label = '']
      
      node [fillcolor = green]
      a [label = '192.168.248.21']
      
      node [fillcolor = red]
      b [label = '176.53.17.23']
      c [label = '46.191.175.120']
      d [label = '200.112.252.155']
      e [label = '177.77.205.145']
      f [label = '124.39.226.162']
      
      node [fillcolor = orange]
      g [label = 'TCP']
      h [label = 'HTTP']
      
      node [fillcolor = cyan]
      i [label = '60']
      j [label = '220']
      
      edge [color = black]
      a -> {b c d e f}
      b -> a
      c -> a
      d -> a
      e -> a
      f -> a
      
      edge [color = orange]
      g -> {a b c d e f}
      
      edge [color = purple]
      h -> {a b}
      
      edge [color = cyan]
      g -> i
      h -> j
      }",
engine = "circo")

--------------------------------------------------------------------------------------------------------------------------

Visualization 2: Graphviz ZeroAccess network dot plot


Visualization 2 code


library(DiagrammeR)
grViz("
digraph {
      
      graph [overlap = false]      
      
      node [shape = circle,
      style = filled,
      color = black,
      label = '']
      
      node [fillcolor = green]
      a [label = '192.168.248.21']
      
      node [fillcolor = red]
      b [label = '176.53.17.23']
      c [label = '46.191.175.120']
      d [label = '200.112.252.155']
      e [label = '177.77.205.145']
      f [label = '124.39.226.162']
      
      node [fillcolor = orange]
      g [label = 'TCP']
      h [label = 'HTTP']
      
      node [fillcolor = cyan]
      i [label = '60']
      j [label = '220']
      
      edge [color = black]
      a -> {b c d e f}
      b -> a
      c -> a
      d -> a
      e -> a
      f -> a
      
      edge [color = orange]
      g -> {a b c d e f}
      
      edge [color = purple]
      h -> {a b}
      
      edge [color = cyan]
      g -> i
      h -> j
      }",
engine = "dot")

--------------------------------------------------------------------------------------------------------------------------
Visualization 3: Graphviz ZeroAccess network twopi plot


Visualization 3 code

library(DiagrammeR)
grViz("
digraph {
      
      graph [overlap = false]      
      
      node [shape = circle,
      style = filled,
      color = black,
      label = '']
      
      node [fillcolor = green]
      a [label = '192.168.248.21']
      
      node [fillcolor = red]
      b [label = '176.53.17.23']
      c [label = '46.191.175.120']
      d [label = '200.112.252.155']
      e [label = '177.77.205.145']
      f [label = '124.39.226.162']
      
      node [fillcolor = orange]
      g [label = 'TCP']
      h [label = 'HTTP']
      
      node [fillcolor = cyan]
      i [label = '60']
      j [label = '220']
      
      edge [color = black]
      a -> {b c d e f}
      b -> a
      c -> a
      d -> a
      e -> a
      f -> a
      
      edge [color = orange]
      g -> {a b c d e f}
      
      edge [color = purple]
      h -> {a b}
      
      edge [color = cyan]
      g -> i
      h -> j
      }",
engine = "twopi")

--------------------------------------------------------------------------------------------------------------------------

Visualization 4: Graphviz ZeroAccess network neato plot


Visualization 4 code


library(DiagrammeR)
grViz("
digraph {
      
      graph [overlap = false]      
      
      node [shape = circle,
      style = filled,
      color = black,
      label = '']
      
      node [fillcolor = green]
      a [label = '192.168.248.21']
      
      node [fillcolor = red]
      b [label = '176.53.17.23']
      c [label = '46.191.175.120']
      d [label = '200.112.252.155']
      e [label = '177.77.205.145']
      f [label = '124.39.226.162']
      
      node [fillcolor = orange]
      g [label = 'TCP']
      h [label = 'HTTP']
      
      node [fillcolor = cyan]
      i [label = '60']
      j [label = '220']
      
      edge [color = black]
      a -> {b c d e f}
      b -> a
      c -> a
      d -> a
      e -> a
      f -> a
      
      edge [color = orange]
      g -> {a b c d e f}
      
      edge [color = purple]
      h -> {a b}
      
      edge [color = cyan]
      g -> i
      h -> j
      }",
engine = "neato")

Read in a CSV and render plot

Populating graphs arbitrarily as above as examples is nice...for examples. In the real world, you'd likely just want to read in a CSV derived from a Wireshark capture.
As my code is crap at this time, I reduced zeroaccess.csv to just the source and destination columns, I'll incorporate additional data points later. To use this from your own data, reduce CSV columns down to source and destination only.
Code first, with comments to explain, derived directly from Rich Iannone's DiagrammerR example for using data frames to define Graphviz graphs.


Visualization 5 is your result. As you can see, 192.168.248.21 is the center of attention and obviously our ZeroAccess victim. Yay, visualization!

Visualization 5

Following is a quick data summary, but you can grab it from Github too.

Network Data

Summary: zeroaccess.csv

zeroaccess <- span=""> read.csv("zeroaccess.csv", sep = ",")
summary(zeroaccess)

##             Source            Destination  Protocol       Length       
##  192.168.248.21:340   192.168.248.21:152   HTTP: 36   Min.   :  54.00  
##  176.53.17.23  : 90   176.53.17.23  : 90   TCP :456   1st Qu.:  60.00  
##  140.112.251.82:  6   140.112.251.82:  6              Median :  62.00  
##  178.19.22.191 :  6   178.19.22.191 :  6              Mean   :  84.98  
##  89.238.36.146 :  6   89.238.36.146 :  6              3rd Qu.:  62.00  
##  14.96.213.41  :  3   1.160.72.47   :  3              Max.   :1506.00  
##  (Other)       : 41   (Other)       :229

head(zeroaccess)

##           Source    Destination Protocol Length
## 1 192.168.248.21   176.53.17.23      TCP     62
## 2 192.168.248.21   176.53.17.23      TCP     62
## 3 192.168.248.21   176.53.17.23      TCP     62
## 4   176.53.17.23 192.168.248.21      TCP     62
## 5 192.168.248.21   176.53.17.23      TCP     54
## 6 192.168.248.21   176.53.17.23     HTTP    221

In closing

Hopefully this leads you to wanting to explore visualization of security data a bit further, note the reference material in Acknowledgments.
I've stuffed all this material on Github for you as well and will keep working on the CSV import version as well.
Ping me via email or Twitter if you have questions (russ at holisticinfosec dot org or @holisticinfosec). Cheers…until next month.

Acknowledgements

Rich Iannone for DiagrammeR and the using-data-frames-to-define-graphviz-graphs example
Jay and Bob for Data-Driven Security (the security data scientist's bible)

Saturday, August 01, 2015

toolsmith: There Is No Privacy - Hook Analyser vs. Hacking Team


Prerequisites
Hook Analyser
Windows OS

Introduction
As we explore privacy in this month’s ISSA Journal, timing couldn’t be better. Since last we convened, the Hacking Team breach has informed us all that privacy literally is for sale. Hacking Team’s primary product is Remote Control System (RCS), “a solution designed to evade encryption by means of an agent directly installed on the device to monitor. Evidence collection on monitored devices is stealth and transmission of collected data from the device to the RCS server is encrypted and untraceable.” While Hacking Team initially claimed their products are not sold to “governments or to countries blacklisted by the U.S., E.U., U.N., NATO or ASEAN” the data dump made public as result of their breach indicated otherwise. In fact, their customers include major players in finance, energy, and telecommunications. Among all the 0-days and exploits in the Hacking Team dump, it was even discovered that they offered UEFI BIOS rootkit to ensure “that it silently reinstalls its surveillance tool even if the hard drive is wiped clean or replaced.” With industry giants willing to seemingly utilize the likes of RCS, we’re left to wonder where the line will be drawn. I long ago assumed there is no line and therefore assume there is no privacy. May I recommend you join me in this gloomy outlook?
Perhaps a little proof may help you come to terms with this simple rule: don’t store or transmit via digital media that what which you don’t want read by anyone and everyone.
To get to the heart of the matter, we’ll assess some Hacking Team “products”, pulled from the public dump, with Beenu Arora’s Hook Analyser. Beenu just celebrated the release of Hook Analyser 3.2 as of 19 JUL. You may recall that I mentioned Hook Analyser via the Internet Storm Center Diary for the Keeping The RATs Out series, we’ll put it through its paces here. Per Beenu, Hook Analyser is a freeware project which brings malware (static & dynamic) analysis and cyber threat intelligence capabilities together. It can perform analysis on suspicious or malware files and can analyze software for crash-points or security bugs. The malware analysis module can perform the following actions:
·         Spawn and Hook to Application
·         Hook to a specific running process
·         Static Malware Analysis
o   Scans PE/Windows executables to identify potential malware traces
·         Application crash analysis
o   Allows you to analyze memory content when an application crashes
·         Exe extractor
o   Extracts executables from running process/s
The Cyber Threat Intelligence module provides open source intelligence where you can search for IP addresses, hashes or keywords. It will collect relevant information from various sources, analyze the information to eliminate false-positives, correlate the various datasets, and visualize the results. 
What better to run Hacking Team binaries through. Let’s begin.
Hacking Team Samples

I pulled four random binaries out of the Hacking Team dump for analysis, sticking exclusively to EXEs. There are numerous weaponized document and media files, but I was most interested in getting to the heart of the matter with Hook Analyser. Details for the four samples follow:
1.       agent 222.exe
a.       MD5: fea2b67d59b0af196273fb204fd039a2
b.       VT: 36/55
2.       agent 1154.exe
a.       MD5: c1c99e0014c6d067a6b1092f2860df4a
b.       VT: 31/55
3.       Microsoft Word 2010 2.exe
a.       MD5: 1ea8826eeabfce348864f147e0a5648d
b.       VT: 0/55
4.       my_photo_holiday_my_ass_7786868767878 19.exe
a.       MD5: e36ff18f794ff51c15c08bac37d4c431
b.       VT: 48/55
I found it interesting that one of the four (Microsoft Word 2010 2.exe) exhibited no antimalware detection via Virus Total as this was written, so I started there.

Hook Analyser

Hook Analyser is stand-alone and runs in console mode on contemporary Windows systems. For this effort I ran it on Windows 7 x32 & x64 virtual machines. The initial UI as seen in Figure 1 is basic and straightforward.

Figure 1 – Hook Analyser UI
For Microsoft Word 2010 2.exe I opted to use Spawn and Hook to Application and provided the full path to the sample. Hook Analyser exited quickly but spawned C:\tools\Hook Analyser 3.2\QR7C8A.exe, with which I repeated the process. The result was a robust output log to a text file named by date and time of the analysis, and an XML report, named identically, of the high-level behaviors of the sample.  A few key items jumped right out in the reports. First, the sample is debug aware. Second, it spawns a new process. Third, Hook Analyser found one trace of a potential PDB/Project at offset 00007F0. When I ran strings against the sample I found c:\users\guido\documents\visual studio 2012\Projects\fake_office\Release\fake_office.pdb, confirming the project and even the developer. I’d have to err on the side of threat related in this scenario, just on project name alone. Further analysis by Microsoft’s Malware Protection Center revealed that it checks for the presence of a legitimate instance of winword.exe on C: or D:, then executes C:\a.exe. As a results, this sample has been classified “threat related”. Based on naming conventions followed by Hacking Team, one can reasonably conclude that C:\a.exe is likely an RCS agent. By the way, Guido, in this case, is probably Guido Landi, a former senior Hacking Team software developer.
You can see the overall output from both reports in a combined Figure 2.

Figure 2 – Hook Analyser results

I took a different approach with the next sample analysis, specifically agent 222.exe. I first executed the sample, then chose Hook to a specific running process. Hook Analyser then provides a listing of all active processes. Agent 222.exe showed itself with process ID 3376. I entered 3376 and Hook Analyser executed a quick run and spawned GVNTDQ.exe. I reran Hook Analyser, selected 3 for Perform Static Malware Analysis, and provided C:\tools\Hook Analyser 3.2\GVNTDQ.exe. GVNTDQ.exe is simply a new instance of Agent 222.exe. This time another slew of very interesting artifacts revealed themselves.  The “agent” process runs as TreeSizeFree.exe, an alleged hard disk space manager from JAM Software, and runs as trusted given that it is signed by a Certum/Unizeto cert. It also appears to be anti-debugging aware and packed using an unknown packer. The sample manipulates GDI32.dll, the OS’s graphic device interface and
WINHTTP.dll (mapped in memory) with a WinHttpGetIEProxyConfigForCurrentUser call, which provides the Internet Explorer proxy settings for the current active network connection. Remember that privacy you were so interested in maintaining?

Let’s say you’re asked to investigate a suspect system, and you have no prior knowledge or IOCs. You do discover a suspicious process running and you’d like to dump it. Choose Exe Extractor (from Process), reply no when it asks if you’d like to dump all processes, then provide the process ID you’d like extracted. It will write an EXE named for the process ID to your Hook Analyser working directory.
You can also run batch jobs against a directory of samples by choosing Batch Malware Analysis, then providing the path to the sample set.

I’d be remiss if I didn’t use the Threat Intelligence module with some of the indicators discovered with Hook Analyser. To use it, you really want to prep it first. The Threat Intelligence module includes:
·         IP Intelligence
·         Keyword Intelligence
·         Network file analysis
o   PCAP
·         Social Intelligence
o   Pulls data from Twitter for user-defined keywords, performs network analysis
Each of these is managed by a flat text file as described in Beenu’s recent post. One note, don’t get to extravagant with your keywords. Try to use unique terms that are tightly related to your investigation and avoid using broad terms such as agent in this case. I dropped a Hacking Team-related IP address in the intelligence-ipdb.txt file, the keywords Certum, Unizeto, Hacking Team, and RCS in keywords.txt, and Hacking Team in channels.txt. Tune these files to your liking and current relevance. As an example URL.txt has some extremely dated resources from which it pulls IP information, there’s no reason to waste cycles on all of the default list. I ran the Threat Intelligence module as a standalone feature as follows: ThreatIntel.exe -auto. Give it a bit of time, it checks against all the provided sources and against Twitter as well. Once complete it will pop a view open in your default browser. You’ll note general information under Global Threat Landscape including suspicious IPs and ASNs, recent vulnerability data, as well as country and geo-specific threat visualizations. More interesting and related to your investigation will be the likes of Keyword based Cyber Intelligence.  The resulting Co-relation (Bird Eye) view is pretty cool, as seen in Figure 3.

Figure 3 – A bird’s eye view to related Hacking Team keywords
Drill into the complete view for full keyword content results. I updated channels.txt to include only hackingteam and intelligence-ipdb.txt with related Hacking Team IP addresses. While I was unable to retrieve viable results for IP intelligence, the partial results under Social Intelligence (Recent Tweets) were relevant and timely as seen in Figure 4.

Figure 4 – Recent Hacking Team related Tweets per the Threat Intelligence module
There are a few bugs that remain in the Threat Intelligence module, but it definitely does show promise, I’m sure they’ll be worked out in later releases.

In Conclusion

The updates to the Threat Intelligence module are reasonable, potentially making for a useful aggregation of data related to your investigation, gleaned from your indicators and analysis. Couple that with good run-time and static analysis of malicious binaries and you have quite a combination for your arsenal. Use it in good health, to you and your network!
Ping me via email or Twitter if you have questions (russ at holisticinfosec dot org or @holisticinfosec).
Cheers…until next month.

ACK

Beenu Arora, @beenuar, Hook Analyser developer and project lead

Wednesday, July 01, 2015

toolsmith: Malware Analysis with REMnux Docker Containers

Prerequisites
Docker, runs on Ubuntu, Mac OS X, and Windows

Introduction
ISSA Journal’s theme of the month is “Malware and what to do with it”. This invites so many possible smart-alecky responses, including where you can stick it, means by which to smoke it, and a variety of other abuses for the plethora of malware authors whose handy work we so enjoy each and every day of our security professional lives. But alas, that won’t get us further than a few chuckles, so I’ll just share the best summary response I’ve read to date, courtesy of @infosecjerk, and move on.
“Security is easy:
1)      Don't install malicious software.
2)      Don't click bad stuff.
3)      Only trust pretty women you don't know.
4)      Do what Gartner says.”
Wait, now I’m not sure there’s even a reason to continue here. :-)

One of the true benefits of being a SANS Internet Storm Center Handler is working with top notch security industry experts, and one such person is Lenny Zeltser. I’ve enjoyed Lenny’s work for many years; if you’ve taken SANS training you’ve either heard of or attended his GIAC Reverse Engineering Malware course and likely learned a great deal. You’re hopefully also aware of Lenny’s Linux toolkit for reverse-engineering and analyzing malware, REMnux. I covered REMnux in September 2010, but it, and the landscape, have evolved so much in the five years since. Be sure to grab the latest OVA and revisit it, if you haven’t utilized it lately. Rather than revisit REMnux specifically this month, I’ll draw your attention to a really slick way to analyze malware with Docker and specific malware-analysis related REMnux project Docker containers that Lenny’s created. Lenny expressed that he is personally interested in packaging malware analysis apps as containers because it gives him the opportunity to learn about container technologies and understand how they might be related to his work, customers and hobbies. Lenny’s packaging tools that are “useful in a malware analysis lab, that like-minded security professionals who work with malware or forensics might also find an interesting starting point for experimenting with containers and assessing their applicability to other contexts.”
Docker can be utilized on Ubuntu, Mac OS X, and Windows, I ran it on the SANS SIFT 3.0 virtual machine distribution, as well as my Mac Mini. The advantage of Docker containers, per the What Is Docker page, is simple to understand. First, “Docker allows you to package an application with all of its dependencies into a standardized unit for software development.” Everything you need therefore resides in a container: “Containers have similar resource isolation and allocation benefits as virtual machines but a different architectural approach allows them to be much more portable and efficient.” The Docker Engine is just that, the source from whom all container blessings flow. It utilizes Linux-specific kernel features so to run it on Windows and Mac OS X, it will install VirtualBox and boot2docker to create a Linux VM for the containers to run on Windows and Mac OS X. Windows Server is soon adding direct support for Docker with Windows Server Containers. In the meantime, if you’re going to go this extent, rather than just run natively on Linux, you might as well treat yourself to Kitematic, the desktop GUI for Docker. Read up on Docker before proceeding if you aren’t already well informed. Most importantly, read Security Risks and Benefits of Docker Application Containers.
Lenny mentioned that he is not planning to use containers as the architecture for the REMnux distro, stating that “This distribution has lots of useful tools installed directly on the REMnux host alongside the OS. It's fine to run most tools this way. However, I like the idea of being able to run some applications as separate containers, which is certainly possible using Docker on top of a system running the REMnux distro.” As an example, he struggled to set up Maltrieve and JSDetox directly on REMnux without introducing dependencies and settings that might break other tools but “running these applications as Docker containers allows people to have access to these handy utilities without worrying about such issues.” Lenny started the Docker image repository under the REMnux project umbrella to provide people with “the opportunity to conveniently use the tools available via the REMnux Docker repository even if they are not running REMnux.”
Before we dig in to REMnux Docker containers, I wanted to treat you to a very cool idea I’ve implemented after reading it on the SANS Digital Forensics and Incident Response Blog as posted by Lenny. He describes methods to install REMnux on a SIFT workstation, or SIFT on a REMnux workstation. I opted for the former because Docker runs really cleanly and natively on SIFT as it is Ubuntu 14.04 x64 under the hood. Installing REMnux on SIFT is as easy as wget --quiet -O - https://remnux.org/get-remnux.sh | sudo bash, then wait a bit. The script will update APT repositories (yes, we’re talking about malware analysis but no, not that APT) and install all the REMnux packages. When finished you’ll have all the power of SIFT and REMnux on one glorious workstation. By the way, if you want to use the full REMnux distribution as your Docker host, Docker is already fully installed.

Docker setup

After you’ve squared away your preferred distribution, be sure to run sudo apt-get update && sudo apt-get upgrade, then run sudo apt-get install docker.io.

REMnux Docker Containers

Included in the REMnux container collection as of this writing you will find the V8 JavaScript engine, the Thug low-interaction honeyclient, the Viper binary analysis framework, Rekall and Volatility memory forensic frameworks, the JSDetox JavaScript analysis tool, the Radare2 reverse engineering framework, the Pescanner static malware analysis tool, the MASTIFF static analysis framework, and the Maltrieve malware samples downloader. This may well give you everything you possibly need as a great start for malware reverse engineering and analysis in one collection of Docker containers. I won’t discuss the Rekall or Volatility containers as toolsmith readers should already be intimately familiar with, and happily using, those tools. But it is mighty convenient to know you can spin them up via Docker.
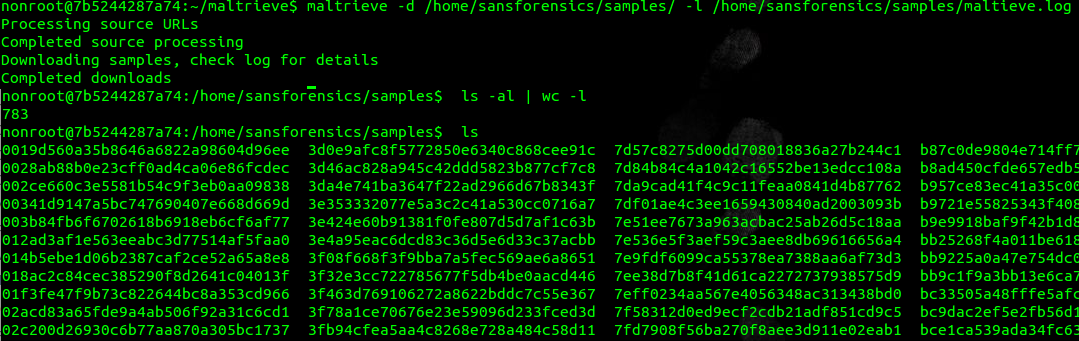
The first time you run a Docker container it will be automatically pulled down from the Docker Hub if you don’t already have a local copy. All the REMnux containers reside there, you can, as I did, start with @kylemaxwell’s wicked good Maltrieve by executing sudo docker run --rm -it remnux/maltrieve bash. Once the container is downloaded and ready, exit and rerun it with sudo docker run --rm -it -v ~/samples:/home/sansforensics/samples remnux/maltrieve bash after you build a samples directory in your home directory. Important note: the -v parameter defines a shared directory that the container and the supporting host can both access and utilized. Liken it to Shared Folders in VMWare. Be sure to run sudo chmod a+xwr against it so it’s world readable/writeable. When all said and done you should be dropped to a nonroot prompt (a good thing), simply run maltrieve -d /home/sansforensics/samples/ -l /home/sansforensics/samples/maltieve.log and wait again as it populates malware samples to your sample directory, as seen in Figure 1, from the likes of Malc0de, Malware Domain List, Malware URLs, VX Vault, URLquery, CleanMX, and ZeusTracker.

Figure 1 – Maltrieve completes its downloads, 780 delicious samples ready for REMnux
So nice to have a current local collection. The above mentioned sources update regularly so you can keep your sample farm fresh. You can also define your preferred DUMPDIR and log directories in maltrieve.cfg for ease of use.

Next up, a look at the REMnux MASTIFF container. “MASTIFF is a static analysis framework that automates the process of extracting key characteristics from a number of different file formats” from @SecShoggoth.  I ran it as follows: sudo docker run --dns=my.dns.server.ip --rm -it -v ~/samples:/home/sansforensics/samples remnux/mastiff bash. You may want or need to replace --dns=my.dns.server.ip with your preferred DNS server if you don’t want to use the default 8.8.8.8. I found this ensured name resolution for me from inside the container. MASTIFF can call the VirusTotal API and submit malware if you configure it to do so with mastiff.conf, it will fail if DNS isn’t working properly. You need to edit mastiff.conf via vi with you API key and enable submit=yes. Also note that, when invoked with --rm parameters, the container will be ephemeral and all customization will disappear once the container exits. You can invoke the container differently to save the customization and the state.
You may want to also instruct the log_dir directive to point at your shared samples directory so the results are written outside the container.
You can then run mas.py /your/working/directory/samplename with your correct preferences and the result should resemble Figure 2.

Figure 2 – Successful REMnux MASTIFF run
All of the results can be found in /workdir/log under a folder named for each sample analyzed. Checking the Yara results in yara.txt will inform you that the while the payload is a PE32 it exhibits malicious document attributes per Didier Steven’s (another brilliant Internet Storm Center handler) maldoc rules as seen in Figure 3.

Figure 3 – Yara results indicating a malicious document attributes
The peinfo-full and peinfo-quick results will provide further details, indicators, and behaviors necessary to complete your analysis.

Our last example is the REMnux JSDetox container. Per its website, courtesy of @sven_t, JSDetox “is a tool to support the manual analysis of malicious Javascript code.” To run it is as simple as sudo docker run --rm -p 3000:3000 remnux/jsdetox, then point your browser to http://localhost:3000 on your container host system. One of my favorite obfuscated malicious JavaScipt examples comes courtesy of aw-snap.info and is seen in its raw, hidden ugliness in Figure 4.

Figure 4 – Obfuscated malicious JavaScript
Feed said script to JSDetox under the Code Analysis tab, run Analyze, choose the Execution tab, then Show Code and you’ll quickly learn that the obfuscated code serves up a malicious script from palwas.servehttp.com, flagged by major browsers and Sucuri.net as distributing malware and acting as a redirector. The results are evident in Figure 5.

Figure 5 – JSDetox results
All the malware analysis horsepower you can imagine in the convenience of Docker containers, running on top of SIFT with a full REMnux install too. Way to go, Lenny, my journey is complete. J

In Conclusion

Lenny’s plans for the future include maintaining and enhancing the REMnux distro with the help of the Debian package repository he set up for this purpose with Docker and containers part of his design. Independently, he will continue to build and catalog Docker containers for useful malware analysis tools, so they can be utilized with or without the REMnux distro. I am certain this is the best way possible for you readers to immerse yourself in both Docker technology and some of the best of the REMnux collection at the same time. Enjoy!
Ping me via email or Twitter if you have questions (russ at holisticinfosec dot org or @holisticinfosec).
Cheers…until next month.

ACK

Thanks again to Lenny Zeltser, @lennyzeltser, for years of REMnux, and these Docker containers.

Monday, June 01, 2015

toolsmith: IoT Fruit - Pineapple and Raspberry

Prerequisites
Wifi Pineapple
Raspberry Pi 2

Introduction
You could call this particular column the Internet of Toolsmith. As much as I am a curmudgeonly buzzword, catch-phrase hater (I lose my mind at RSA and refuse to go any more), the Internet of Things, or IoT is all the rage for good reason. Once obscure items are now connected and as such, at risk. The ability to load a full operating system and a plethora of functionality on a micro device has become trivial thanks to the likes of Raspberry Pi and Arduino. I’d like to point out that the Pwnie Express PwnPlug Elite, built on a Sheevaplug, as discussed in March 2012’s toolsmith, was amongst those devices that met the IoT bar before IoT was all the rage. Kudos to that crazy pack o’ hackers for seeing the imminent future of security challenges with smart devices. In 2013 Chris Clearfield wrote Rethinking Security for the Internet ofThings wherein he stated that “the growing Internet of Things, the connection of physical devices to the internet, will rapidly expand the number of connected devices integrated into our everyday lives. They also have the potential to allow cyber attackers into the physical world in which we live as they seize on security holes in these new systems.” It is in that mindset that we’ll converge security assessment tools and services, as implemented on a couple of tiny devices I’m fond of, with ISSA Journal’s topic of the month. Normally, toolsmith focuses on free and open source tools, and the software we’ll discuss this month continues to meet that bar. That said, it’s impossible to explore IoT without some related “things”, so you’ll need to make a small investment in one or both of the devices we’ll discuss, or experiment similarly on related platforms. If you were to purchase the Wifi Pineapple and the Raspberry Pi 2 (RPI2) kits I own, you’d spend a grand total of $229. Much as the Pwnie Express crew did, the hak5 team started building WiFi penetration testing platforms on tiny hardware as early as 2008. The Raspberry Pi project has enabled all sorts of makers to build miniature attack or assessment systems on devices the size of a pack of playing cards. We’ll drop Kali Linux on a Raspberry Pi 2 here. I chuckled a bit as I wrote this as I was reminded that WiFi Pineapple, intended for WFi hacking, was itself popped at Defcon 22. The language in the resulting message is too salty to print here but it starts with “Dear Lamer” and ends with “criminally insecure” which should convey the general concepts. ;-) That said, the Hak5 team addressed the issues quickly, and the device really is a sound, capable investment; let’s start there.

WiFi Pineapple

Figure 1 – WiFi Pineapple
Wifi Pineapple use is about as easy as plugging in, connecting the included Cat5 cable to a DHCP-enabled NIC, and browsing to http://172.16.42.1:1471. “The WiFi Pineapple firmware is a heavily modified version of OpenWRT, packed with tools to aid your pen testing.” Initial username is root, you’ll assign a password during initial setup. I did flash my Pineapple to the latest firmware, 2.3.0 as this was written, using the WiFi Pineapple MK5 Infusion. Using the Network Infusion, I put my Pineapple in Client Mode, so I could connect to the Internet for updates and install additional Infusions. Using the AutoSSG Infusion I setup the AutoSSH service so I could interact with a remote shell and download/upload file via SCP. Real fun with a Wifi Pineapple can be had when you add Infusions. I immediately added sitesurvey, status, monitor, logcheck, connectedclients, notify, and wifimanager as seen in Figure 2.

Figure 2 – Installing Infusions
Make sure you install all Infusions to SD storage as there is much more available in the SD card, you’ll quickly clog internal storage if you’re not careful.
While WiFI Pineapple is first and foremost a Wifi attack platform, I believe it can be used as a defensive platform as well, in particular a monitoring sensor particularly in an area where many WiFi connected devices are in play and you’d like to monitor the local IoT.
In the Logs Infusion I followed the /tmp/pineap.log which logs probes for SSIDs by MAC addresses.
The PineAP Infusion, with MK5 Karma enabled, will allow you to filter under the Log tab as well. From the Pineapple information content under the PineAP Infusion states that “MK5 Karma is a module of the PineAP suite intended to host spoofed Access Points, or honeypots. This is achieved by replying to probe requests with appropriately crafted probe responses.” You can tweak MK5 Karma and Pine AP as a honeypot to ensure only trusted, known devices connect in your environment. You can then blacklist and whitelist both clients and SSIDs, then send notifications via email or Pushover based on specific rules if you so choose. All the related Infusions are noted in Figure 3.

Figure 3 – Monitor and notify with Pineapple Infusions
As a result, WiFi Pineapple, while a fantastic red team tool, can also be used for defensive monitoring in a highly connected environment where only trusted devices are a requirement.

Raspberry Pi 2

Loading Kali on a Raspberry Pi 2 is also quite simple and is spelled out nicely on Kali.org. Grab a Class 10 SD card and DD the latest image to the card from a *nix host. I ran dd if= kali-1.1.0-rpi2.img of=/dev/sdb bs=512k, used gparted to allocate (resize) all the available storage on my 32GB SD, popped the SD card in my RPI2, and powered it up. You’ll login as root, initial password is toor as expected (change it), then execute startx. Follow the steps in the Kali.org guidance to change your SSH keys as all ARM images are pre-configured with the same keys. Initially, this installation is missing almost all of the Kali packages, easily fixed as follows:

1)  apt-get update
2)  apt-get upgrade
3)  apt-get install kali-linux-full

A bit of patience as kali-linux-full exceeds 3GB, and voila, you’re running Kali on a kick@$$ wallet-sized computer!
Here’s a scenario I imagine a RPI2 being useful in for a penetration test/red team exercises, given that it is both inexpensive and concealable. You’re assessing an organization that has a significant public area (lobby, customer services offices, conference rooms, and auditorium). The organization offers guest WiFi and does not lock down numerous Cat5 wall jacks. Your recon determines that:
1)      There is a keys-to-the-castle health services database on the internal organization network that is your ultimate goal and primary agenda for the assessment
2)      There is a location in the public space near a cabinet and a large plant where a WiFi enabled RPI2 (Figure 4) can be plugged into both power and one of the unregulated wall jacks. Even if discovered in a day or two, you only need a few hours.

Figure 4 – Raspberry Pi 2 (in camera support case)
After “installing” your device, you can access it over the public WiFI as wlan0 is serving up SSH in the same IP range as your laptop. You’re simply sitting in the organizations public café, seemingly browsing the Intarwebs during lunch. As an added bonus, you find that the wired connection to your RPI2 enjoys unfettered access to the internal (Intranet) environment. You nmap it accordingly and discover a few hosts offering up HTTP and HTTPS. You can kick in a little X11 forwarding on your RPI2 or tunnel through your RPI2 and browse the sites directly from your laptop in the café. Sure enough, after a bit of review, you discover that one of these web servers hosts the front end for that health services database you seek. You quickly recognize that the Security Development Lifecycle long ago left the building (may never have entered) and that this front end is rampant with SQL injections vulns. You ready SQLmap and strike while the iron is hot. You run the following from your RPI2 and in four quick steps have dumped the patient db. Great, now you have to write the report.

1)  sqlmap.py --url="http://vlab02.pneumann.com/patients13/?bill_month=8&sec=HSPO14" --data="bill_month" --banner
2)  sqlmap.py --url="http://vlab02.pneumann.com/patients13/?bill_month=8&sec=HSPO14" --data="bill_month" --dbs
3)  sqlmap.py --url="http://vlab02.pneumann.com/patients13/?bill_month=8&sec=HSPO14" --data="bill_month" -D db337433205 --tables
4)  sqlmap.py --url="http://vlab02.pneumann.com/patients13/?bill_month=8&sec=HSPO14" --data="bill_month" --dump -D db337433205 -T dbo337433205.PATIENTS

The above gives you the database banner, the populated databases, the tables in the db337433205 database, and then,yep, there’s the proverbial gold in that dump (Figure 5).

Figure 5 – SQLmap strikes gold from Kali on Raspberry Pi 2
 By the way, if want to take screenshots in Kali on and RPI2, you’ll need to run apt-get install xfce4-screenshooter-plugin to enable the app, you’ll find it under Accessories thereafter.
This is but one example of an endless slew of opportunities running Kali and other distros from this credit card-sized device. Grab some spare SD cards and build out a few of your favorites, then swap them in as you want to boot them up. Some RPI2 kits come with NOOBS on an 8GB SD card as well, which will help get you started and your feet wet. Hackers/makers rejoice! I’m going to add sensors and a camera to my kit so I can implement specific scripted actions when movement initiated. 
   
In Conclusion

Working with the Raspberry Pi 2 or earlier versions allows you so many options. You’ll recall that FruityWifi, as discussed in November 2014, is specifically tailored to Raspberry Pi, and there are Pwn Pi, Raspberry Pwn (from Pwnie Express), and MyLittlePwny, amongst others. Grab a kit today and get started, it’ll be great for your Linux skills development, and can be used for attack or defense; the options are literally endless. I’d also be remiss if I didn’t mention that Microsoft is releasing Windows 10 for IoT (Windows 10 IoT Core), currently in Insider Preview mode, so you can play on the Windows front as well.
Ping me via email or Twitter if you have questions (russ at holisticinfosec dot org or @holisticinfosec).
Cheers…until next month.

Moving blog to HolisticInfoSec.io

toolsmith and HolisticInfoSec have moved. I've decided to consolidate all content on one platform, namely an R markdown blogdown sit...